 Adobe Community

Copy link to clipboard
Copied
the SDK for new lightroom (7.3) mentions that Look Tables can be used as well as LUTs (look up tables). these Look Tables appear to be CSV files and the SDK came with an example. how do I interpret these Look Table files?
*originally posted this question in the Lightroom Classic forum but was suggested that you guys would be able to help*


 1 Correct answer

Ok, here is my explanation of what's in the SDK example looktable.csv, which is making the "cool colors" black and leaving the other colors alone.
The three numbers in each row of the look table are:
Hue-Delta number, (+/- hue) where 0 means no change in hue.
Saturation-Scale number, (x saturation) where 1 means no change in saturation.
Value-Scale number (x value or brightness) where 1 means no change in brightness.
In the looktable.csv example, most of the rows have 0, 1, 1, meaning no change in th
... 9
Replies
9
9
Replies
9

Copy link to clipboard
Copied
I am trying to learn about this too. It is obviously different from a LUT file but why and how? What is the rationale for using a LookTable vs a LUT or in addition to a LUT in a profile?
Copy link to clipboard
Copied
Have you read the information in the new Enhance Profiles PDF contained in the new Profiles SDK (April 2018) link on the DNG Resources page?

Digital Negative (DNG), Adobe DNG Converter | Adobe Photoshop CC

Copy link to clipboard
Copied
Hey ssprengel I have read but that is what I am looking for more clarity on. I also have the sample looktable.csv file but not sure what it represents. the SDK mentions that it is just an example that slams cool hues to black. not sure how to interpret the file though - how does it target cool hues specifically

Copy link to clipboard
Copied
Hey photoshop man! So I'm experimenting with profiles right now - been making my own LUTs for ages, but the "look table" (not look up table) is stumping me. I read what you wrote about them - but something confuses me. If the look tables/csv files only affect hue/sat and, to some extent, brightness (color brightness?) - then how are the default adobe profiles (adobe color, adobe landscape, etc.) able to affect more than that? For instance, when I apply adobe landscape it seems to go beyond color and add some contrast or shape to my images. If using no change other than the landscape profile - then going to create a new profile (to examine what's going on) - it lists basic, point curve, low tonemapping, and the look table for landscape. So is the profile using a curve move, as well?
Basically I'm trying to figure out how to find the landscape profile and export it out as a user preset or LUT that would allow me to use it on non-raw images, if that is possible.
However, I cannot seem to even locate the curve value, if any, or the .csv Look Table's physical file. Any ideas?
Thanks!
Copy link to clipboard
Copied
Ok, here is my explanation of what's in the SDK example looktable.csv, which is making the "cool colors" black and leaving the other colors alone.
The three numbers in each row of the look table are:
Hue-Delta number, (+/- hue) where 0 means no change in hue.
Saturation-Scale number, (x saturation) where 1 means no change in saturation.
Value-Scale number (x value or brightness) where 1 means no change in brightness.
In the looktable.csv example, most of the rows have 0, 1, 1, meaning no change in the H, S, or V numbers.
For "cool colors" however, we have 0, 1, 0, meaning set the brightness to 0 but leave the hue and saturation alone.
In general, hues are given in degrees from 0 to 360 representing red, orange, yellow, green, blue, purple, back-to-red. What are "cool colors"? They are the cyans, blues and purples.
In the example looktable.csv the first line header has 4 numbers: 8, 3, 4, 1 where 8 is the number of hue segments.
Visually it looks like this, with the hue scale of 0-360 is divided into 8 segments labeled 0 to 7, so the cool hues are segments 4, 5, 6, or if there is rounding 3.5 to 6.5, not sure, and "cool colors" is somewhat open to interpretation, and I'd probably only have it be segments 4 and 5, not also 6, but I'm trying to explain what the looktable.csv is about, not how I'd make it different:

Besides the Hues being divided into 8 segments, the Saturation axis is divided into 3 segments and the Value axis into 4. I've indicated this with the, unintentionally unevenly-spaced, red dots.
All that is somewhat easy to understand. The difficulty is understanding what rows in the look table correspond to what colors in the rainbow-strip and HSV-cone in the illustration, above.
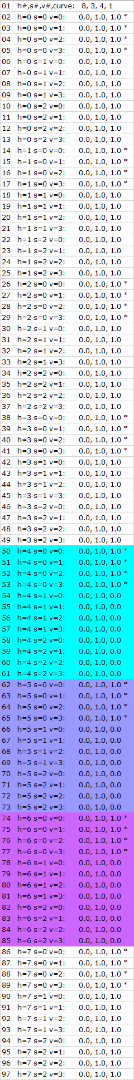
To determine this, based on the pseudo-code in the PDF, I wrote a C# program in LINQPad 5 to output not only the rows of the looktable.csv but also the corresponding HSV color-segment numbers, where the Hue segment numbers go from 0 to 7 (8 segments), the Saturation-segment numbers go from 0 to 2 (3 segments) and the Value segment numbers go from 0 to 3 (4 segments).
Here is the portion of the output dealing with the "cool colors" Hue segments 4, 5, 6, where I've changed the background color of the Excel spreadsheet rows to indicate the approximate "cool color" the hue segment is.

Here is a screenshot of my C# code in LINQPad. It didn't make sense that the pseudo-code had the v segment numbers at 1 instead of 0 like the h and s segment numbers, and it didn't make sense to do something when v was 0 so I left that out as well:

LINQPad is available, here, where the free version doesn't do auto-formatting or auto-completion, but otherwise works:
And here is the entire output of the program, all 97 lines, that correspond to the 97 lines of looktable.csv:
Copy link to clipboard
Copied
Thanks ssprengel!! this was a great and thorough writeup. thanks for taking the time to explain it all out in such clear detail. amazing!!!
Copy link to clipboard
Copied
could excel be used to create the CSV file?
Copy link to clipboard
Copied
Sure, if you save as CSV format.
Copy link to clipboard
Copied
And what if, for example, we wanted to create a raw profile that falls somewhere in between adobe landscape (with tonemapping high) and adobe color, as sort of a middle ground? Is this possible, ssprengel ?

 AdChoices