 Adobe Community
- Home
- Air
- Discussions
- Re: Using scout to analyse garbage collection
- Re: Using scout to analyse garbage collection
Using scout to analyse garbage collection
Copy link to clipboard
Copied
Hi all,
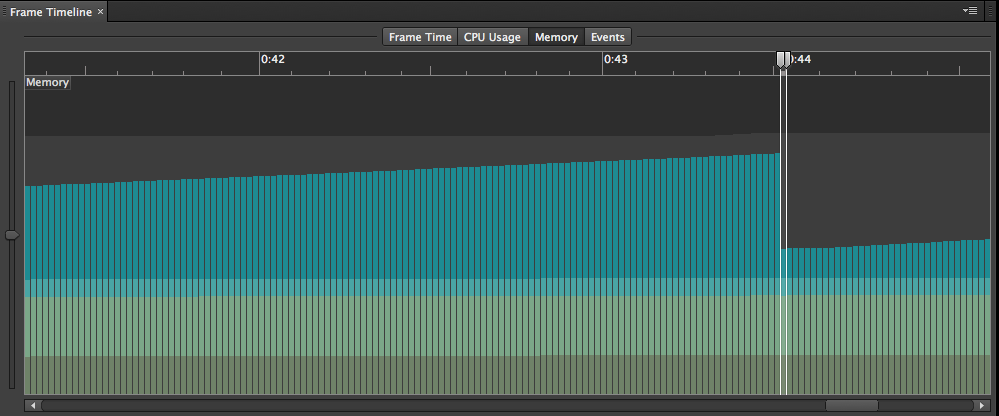
My latest game is very action oriented. However, every 2 seconds (regularly as clockwork) the game will pause noticeably for a split second. Adobe Scout CC tells me this is when some major garbage collection happens. Garbage collection is taking about 600 - 650ms at that time (on iPhone5).
Question: How can i get scout to show me exactly what is being garbage collected? Which objects and/or where they were created? I have 'CPU usage', 'AS Sampler', and 'Mem Allocation Tracking' all set to ON.
Background: I am using object pooling for everything in my game loop (enemies, projectiles, powerups etc). I even use private properties for iterating loops ('i' is declared as a private property, for example) so that there is no memory allocation there - but I have obviously missed something! Just want to find out what 
Any help appreciated,
Peter


 4
Replies
4
4
Replies
4
Copy link to clipboard
Copied
I've been making some headway. It's a whole bunch of little things that slowly add up and then get booted during GC every 2 seconds.
About 12-13kb worth each time. Some of it i can't really do anything about (e.g. a new Point is created when 'localToGlobal' is called - unless I write my own localToGlobal routine).

Copy link to clipboard
Copied
Some of it i can't really do anything about (e.g. a new Point is created when 'localToGlobal' is called - unless I write my own localToGlobal routine).
This sounds suspiciously like you are using Starling (you didn't say)
If in fact you mean calls to Starling's localToGlobal, there most certainly is something you can do about it.
Sounds as if you are not taking advantage of all the alternate versions of these functions that take optional result instance arguments.
Ie. you shouldn't be just calling DisplayObject.localToGlobal(localPoint:Point) but the two arg version using localToGlobal(localPoint:Point, resultPoint:Point) where you might pass a static reusable Point instance for the result. This prevents a new Point instance to be created on every call.
Sounds like you need to go through your code and make sure you use the alternate versions of functions that help avoid object creation, localToGlobal isn't the only one.
To just mention a few others:
DisplayObject.getBounds(targetSpace:DisplayObject, resultRect:Rectangle=null)
TouchEvent.getTouches(target:DisplayObject, phase:String=null,result:Vector.<Touch>=null)
...
It is up to you to to call the fuller form of these functions passing in reused result object instances to avoid temporary object creation when using Starling.
A few others mentioned in this forum post:
Copy link to clipboard
Copied
Thanks Jeff, but no, I'm not using Starling.
I've found the main culprits. I'm now using an LUT to solve the localToGlobal issue (there are onl ya discrete number of cases for this, so it works fine), and slowly tracking down the others.
Copy link to clipboard
Copied
Ok - so I found the main reason for the stutter- Adobe Scout itself. If I use scout to analyse memory (de)allocations GC takes maybe 500-600ms and is very obviously noticable. If I don't use scout, i don't notice any GC slowdown.
The other objects that are slowly increasing memory every frame (maybe 10kb every 10 seconds) are a single ENTER_FRAME Event object, and the myriad TOUCH_MOVE TouchEvent objects to track fingers as they move.
Does anyone know if there is a way to access a vector of current touch points rather than rely on an Event? At the moment I have a single 'Input manager' that listens for these touch events that can be accessed by anyone who needs them (no events from ther on in), but it would be great to do away with the TOUCH_MOVE event altogether (similar to stage.mouseX/Y for mouse).
 AdChoices