


Copy link to clipboard
Copied
I have an application that trades virtual items and have a single page which gets all my accounts and for each one creates a thread that firstly logs the account in and then searches and buys for items for as long as the session is active. I should point out at this point that this is my first experience of using cfthread.
I'm having issues with it. Every 30 minutes (if not less) my ColdFusion server comes to a standstill and I have to restart the service. Upon restarting the service I check the logs and there are errors that say "GC Overhead Limit Exceeded".
I have looked extensively online but as much as cfthread is new to me, so is the JVM and how it operates. I'm running on CF10 Enterprise Edition and have loaded up the server monitor and surely enough I can see the JVM memory usage grow and grow until the limit has been reached (just now I have it set as 2gb as when I had it set higher the memory seemed to fill up quicker). Even when I select the Run GC option in the monitor it does not reduce the memory usage very much, if at all.
Is this more than likely something to do with my code? At the moment I have just under 50 threads being created but as I add more accounts to the application then the more threads that will be required.
Here is the code from the page...
<script>
/* RELOAD PAGE EVERY 65 MINUTES */
setTimeout(function(){
window.location.reload(1);
}, 3900000);
</script>
<!--- GET ACTIVE ACCOUNTS --->
<cfquery name="getLogins" datasource="myDB">
SELECT * FROM Logins WHERE active = 1
</cfquery>
<!--- LOOP THROUGH ACCOUNT --->
<cfloop query="getLogins">
<!--- HAVE A SLEEP SO IP DOESN'T GET FLAGGED FOR SENDING TOO MANY REQUESTS AT ONCE --->
<cfset Sleep(30000) />
<!--- CREATE THREAD FOR ACCOUNT --->
<cfthread
name="#getLogins.accountName#"
action="run"
accountName="#Trim(getLogins.accountName)#"
email="#Trim(getLogins.email)#"
password="#Trim(getLogins.password)#"
resourceId="#Trim(getLogins.resourceID)#">
<!--- DEFAULT SESSION VARIABLES --->
<cfset SESSION["#attributes.accountName#LoggedIn"] = 0 />
<cfset SESSION["#attributes.accountName#LoginAttempts"] = 0 />
<!--- WHILE ACCOUNT NOT LOGGED IN AND LESS THAN 8 LOGIN ATTEMPTS MADE --->
<cfscript>
while (SESSION['#attributes.accountName#LoggedIn'] EQ 0 AND SESSION['#attributes.accountName#LoginAttempts'] LT 8) {
// ATTEMPT LOGIN
THREAD.logInAccount = Application.cfcs.Login.logInAccount(attributes.email,attributes.password);
// IF LOGIN ATTEMPT UNSUCCESSFUL
if (THREAD.logInAccount EQ 0) {
// INCREASE ATTEMPT COUNT
SESSION['#attributes.accountName#LoginAttempts'] = SESSION['#attributes.accountName#LoginAttempts'] + 1;
}
// ELSE IF RETURNED VALUE IS 481 THEN ACCOUNT IS LOCKED
else if (THREAD.logInAccount EQ 481) {
// SET LOGIN ATTEMPT COUNT TO STOP LOOP
SESSION['#attributes.accountName#LoginAttempts'] = 8;
// UPDATE ACCOUNT TO MARK AS LOCKED
THREAD.updLogin = Application.cfcs.Login.updLogin(attributes.email);
}
}
</cfscript>
<!--- IF ACCOUNT LOGGED IN --->
<cfif SESSION['#attributes.accountName#LoggedIn'] EQ 1>
<!--- SET ID FOR SEARCHING --->
<cfset THREAD.definitionID = attributes.resourceID - 1610612736 />
<!--- WHILE ACCOUNT LOGGED IN --->
<cfloop condition="SESSION['#attributes.accountName#LoggedIn'] EQUALS 1">
<!--- GET LATEST LOWEST BUY NOW PRICE --->
<cfquery name="THREAD.getMinBIN" datasource="FUT" cachedWithin="#CreateTimeSpan(0,0,1,0)#">
SELECT TOP 1 * FROM v_FUT14BINPrices WHERE resourceID = #attributes.resourceId# ORDER BY lastUpdated DESC
</cfquery>
<!--- INCLUDE FILE THAT CALCULATES BUYING AND SELLING PRICES --->
<cfinclude template="sellingPrices.cfm" />
<!--- IF BIDDING PRICE HAS BEEN SET --->
<cfif StructKeyExists(THREAD,"biddingPrice")>
<!--- MAKE SEARCH REQUEST, TIMING THE REQUEST --->
<cfset THREAD.requestStart = GetTickCount() />
<cfset THREAD.search = Application.cfcs.Search.dosearchOld(attributes.resourceId,THREAD.biddingPrice,0) />
<cfset THREAD.requestDuration = GetTickCount() - THREAD.requestStart />
<!--- IF SEARCH CONTAINS FILE CONTENT --->
<cfif StructKeyExists(THREAD.search,"FileContent")>
<!--- DECLARE NUMBER OF RESULTS VARIABLE --->
<cfset THREAD.numResults = 0 />
<!--- IF JSON RETURNED --->
<cfif IsJSON(THREAD.search.FileContent)>
<!--- DESERIALIZE JSON --->
<cfset THREAD.searchResults = DeserializeJSON(THREAD.search.FileContent) />
<!--- IF PLAYER SEARCH RETURNS AUCTIONINFO STRUCT --->
<cfif StructKeyExists(THREAD.searchResults,"auctionInfo")>
<!--- SET NUMBER OF CARDS RETURNED FROM SEARCH --->
<cfset THREAD.numResults = ArrayLen(THREAD.searchResults.auctionInfo) />
<cfset THREAD.statusCode = "Successful" />
<cfif THREAD.numResults EQ 0>
<cfset THREAD.statusCode = "Successful - No Results" />
</cfif>
<!--- ELSE IF ERROR CODE RETURNED --->
<cfelseif StructKeyExists(THREAD.searchResults,"code")>
<cfset THREAD.statusCode = THREAD.searchResults.code />
<!--- IF CODE 401 THEN SESSION HAS EXPIRED --->
<cfif THREAD.statusCode EQ 401>
<!--- SET SESSION AS LOGGED OUT AND ATTEMPT SESSION REFRESH --->
<cfset SESSION['#attributes.accountName#LoggedIn'] = 0 />
<cfset THREAD.logInAccount = Application.cfcs.Login.logInAccount(attributes.email,attributes.password) />
</cfif>
<!--- ELSE SOMETHING ELSE HAS HAPPENED --->
<cfelse>
<cfset THREAD.statusCode = "Something Else - " & THREAD.searchResults.code />
</cfif>
<!--- IF RESULTS RETURNED --->
<cfif THREAD.numResults GT 0>
<!--- LOOP ROUND RESULTS AND CHECK IF MATCH BUYING CRITERIA --->
<cfloop index="i" from="1" to="#THREAD.numResults#">
<!--- ***SAFETY CHECK*** - ENSURE ID OF CURRENT CARD IS SAME AS ONE SEARCHING FOR --->
<cfif THREAD.searchResults.auctionInfo.itemData.resourceID EQ attributes.resourceId AND THREAD.getMinBIN.resourceID EQ attributes.resourceId>
<!--- ENSURE BIN PRICE SET AND IS LESS THAN SET BUYING PRICE --->
<cfif THREAD.searchResults.auctionInfo.buyNowPrice GT 0 AND THREAD.searchResults.auctionInfo.buyNowPrice LTE THREAD.biddingPrice>
<!--- SET AUCTION END TIME --->
<cfset THREAD.timeLeft = THREAD.searchResults.auctionInfo.expires />
<cfset THREAD.auctionEnds = DateAdd("s",THREAD.timeLeft,Now()) />
<!--- BUY CARD --->
<cfset THREAD.buyCard = Application.cfcs.Bid.doBIN(THREAD.searchResults.auctionInfo.tradeID,THREAD.searchResults.auctionInfo.buyNowPrice,THREAD.searchResults.auctionInfo.startingBid,THREAD.searchResults.auctionInfo.itemData.ID,THREAD.searchResults.auctionInfo.itemData.resourceID,THREAD.startPrice,THREAD.binPrice,THREAD.lowestBIN,THREAD.searchResults.auctionInfo.itemData.discardValue,THREAD.auctionEnds,THREAD.requestStart,THREAD.requestDuration) />
</cfif>
</cfif>
</cfloop>
</cfif>
<cfelse>
<cfset THREAD.statusCode = THREAD.search.FileContent />
</cfif>
<cfset THREAD.sleepDuration = 1000 - THREAD.requestDuration />
<cfif THREAD.sleepDuration GT 0><cfset Sleep(THREAD.sleepDuration) /></cfif>
</cfif>
<!--- INSERT SEARCH RECORD --->
<cfset THREAD.insSearchRecord = Application.cfcs.Search.insSearchRecord(THREAD.definitionID,THREAD.statusCode,THREAD.requestDuration,THREAD.numResults,THREAD.biddingPrice) />
</cfif>
</cfloop>
</cfif>
</cfthread>
</cfloop>
I would have thought that the memory would have stayed around the same usage as each loop is performing the same set of actions so once the loop has went back to the start then I thought the previous loop would have been removed from memory (freeing up space) and then the same actions would be performed so the same memory total would then be used up but it seems almost as if each loop is being kept in memory and that is why it is growing.
Could someone please help me out and offer some guidance on how I could remedy this issue? If you need any more info then just let me know
Thanks in advance


 1 Correct answer

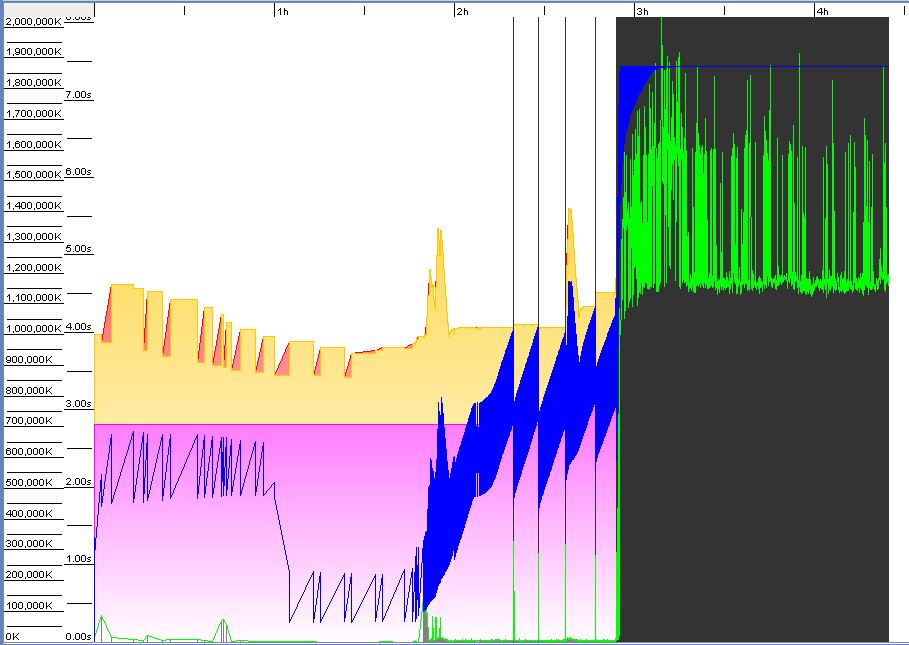
JVM looks like this thanks to gcviewer:
The diagram does not show PermGen details. Tail of log says:
PSPermGen total 1048576K, used 80172K object space 1048576K, 7% used.
While you may have something to resolve with the CFM code, for now to keep the system up perhaps you can do better to make some JVM adjustments. Keep in mind this is probably not a fix for the overall problem more try this to see if the system stays up while you continue to work on other CFM matters.
I expect JVM details are like
... 39
Replies
39
39
Replies
39

Copy link to clipboard
Copied
Ah, thanks. I would experiment with
Minimum heap size: 1024
Maximum heap size: 2048
-XX:MaxPermSize=1024m
I suspect that -XX:MaxPermSize:192m is too small for your purposes.
Copy link to clipboard
Copied
Okay, thanks. Just restarting the service so the changes take effect and will keep you updated.
Copy link to clipboard
Copied
Okay...so that's ColdFusion just grind to a halt after 4 hours (which has been an improvement on recent up-time) and from keeping an eye on the resource monitor in task manager, the ColdFusion CPU consumption was sitting below 20% but it is currently at 85%+ (as I've not stopped the service yet) so I'm wondering if it is just a gradual filling up of the memory (although I'd have expected the CPU consumption to gradually increase) or if there is something going wrong and demanding all the memory suddenly until such point as there is no more free memory.
I'll restart the service and keep an eye on the resource monitor again and see if there is sudden spike in CPU consumption.
Copy link to clipboard
Copied
Hello,
I see thread has moved to discussing JVM arguments so thought I would join in as I refrain from commenting on CFM syntax.
What Java version is CF10 using? Early CF10 installer applied Java 6 (which is Oracle EOL) and latter installer used Java 7.
I see Java logging is enabled so perhaps the details in your last cfjvmGC.log would be interesting. Can you ZIP and host that somewhere so I can download and read log?
Regards, Carl.
Copy link to clipboard
Copied
Progress report...
The service has ran for 3-4 hours on three occasions, the other occasion I ran it the GC overhead limit reached message was encountered after only the 10th account logged in. I'm starting to think that rather than the memory filling up gradually (although increasing the MaxPermSize seems to have helped greatly) that eventually a request is getting stuck and this is causing all the subsequent requests to throttle the memory. Sound plausable?
Carl, I've uploaded my last cfjvmGC.log which can be found at http://www.filedropper.com/cfjvmgc
EDIT: The service just ran for 20 minutes before the GC overhead limit exceed message appeared so that would suggest that a request is getting stuck (for lack of a better term).
Now, with the inclusion of more accounts I have a cfsetting variable at the very start of the file that sets the request timeout to 600 seconds (10 minutes - at present it takes around 6-8 minutes to log all accounts in but the more accounts added the longer this will take obviously).
Could it be that because this overwrites the default CFAdmin timeout setting of 60 seconds that for some reason, quite randomly, a cfhttp or cfquery request is not returning a response in a timely manner and this is causing any subsequent requests to have to wait for this request to finish and this is throttling the memory?
Copy link to clipboard
Copied
cpb07 wrote:
I'm starting to think that rather than the memory filling up gradually ... that eventually a request is getting stuck and this is causing all the subsequent requests to throttle the memory. Sound plausable?
My instincts exactly. There is filling up all right, and not gradually. Should there be talk of 'subsequent requests', in plural? From what I understand, there is just the one request, albeit one that spawns 70+ threads.
EDIT: The service just ran for 20 minutes before the GC overhead limit exceed message appeared so that would suggest that a request is getting stuck (for lack of a better term).
When you consider the 20 minutes together with the line <cfset Sleep(30000) />, it tells you the code never made it past 40 threads. [20 minutes = 1200 seconds. Coldfusion sleeps for 30000 ms, that is, 30 seconds during creation of subsequent threads. 1200 / 30 = 40 ]
Now, I'd mention to BKBK in a discussion we had that there is a scheduled task that runs every 10 minutes that basically gets a list of all the items I'm trading and gets the current lowest buy now price for each. This can often take anywhere between 4-8 minutes to complete so I have a cfsetting variable in the .cfm file that sets the request timeout to 600 seconds (10 minutes - so that even if the task has not completed, it will start again as the lowest buy now price data will now be out of date).
Could it be that because this overwrites the default CFAdmin timeout setting of 60 seconds that for some reason, quite randomly, a cfhttp or cfquery request is not returning a response in a timely manner and this is causing any subsequent requests to have to wait for this request to finish and this is throttling the memory?
To answer these questions, it might help to have a closer look into the threads. Suppose you wish to know how they stand after, say, 30 minutes.
You could then include an extra thread, named sleeper30min, say, that does nothing but wait for 30 minutes. Next, join the main page execution thread to sleeper30min.
At this point, dump all the threads.
It goes something like this:
<cfloop query="getLogins">
<!--- HAVE A SLEEP SO IP DOESN'T GET FLAGGED FOR SENDING TOO MANY REQUESTS AT ONCE --->
<cfset Sleep(30000) />
<!--- CREATE THREAD FOR ACCOUNT --->
<cfthread ...>
etc.
</cfthread>
<!--- Join page thread to thread sleeper30min --->
<cfthread action="join" name="sleeper30min" timeout="1800000" />
<cfif sleeper30min.STATUS is "TERMINATED">
<!--- Get out of loop --->
<cfbreak>
</cfif>
</cfloop>
<cfif sleeper30min.STATUS is "TERMINATED">
<cfloop query="getLogins">
<cfset thread_name = getLogins.accountName>
<cfdump label="Thread #thread_name#" var="#evaluate(thread_name)#">
</cfloop>
</cfif>
Copy link to clipboard
Copied
Not even getting 30 minutes up-time anymore, memory threshold seems to be getting exceeded after 10-15 minutes for whatever reason...grrrrrrr! Will report back further.
Copy link to clipboard
Copied

JVM looks like this thanks to gcviewer:
The diagram does not show PermGen details. Tail of log says:
PSPermGen total 1048576K, used 80172K object space 1048576K, 7% used.
While you may have something to resolve with the CFM code, for now to keep the system up perhaps you can do better to make some JVM adjustments. Keep in mind this is probably not a fix for the overall problem more try this to see if the system stays up while you continue to work on other CFM matters.
I expect JVM details are like this currently:
Minimum heap size: 1024
Maximum heap size: 2048
-XX:MaxPermSize=1024m
The overall system is:
CF10 on a Windows 7 x64 machine with an Intel core i3-2100 processor and 8GB RAM.
Seeing not many objects are maintained in PermGen you can make that smaller. Double heap sizes and set a value for the new part of heap. EG:
Minimum heap size: 2048
Maximum heap size: 4096
-XX:MaxPermSize=324m
-Xmn256m
Or this way if you prefer in CFadmin:
-server -Xmn256m -XX:MaxPermSize=324m -XX:PermSize=192m -XX:+UseParallelGC -Xbatch -Dcoldfusion.home={application.home} -Dcoldfusion.rootDir={application.home} -Dcoldfusion.libPath={application.home}/lib -Dorg.apache.coyote.USE_CUSTOM_STATUS_MSG_IN_HEADER=true -Dcoldfusion.jsafe.defaultalgo=FIPS186Random -XX:+PrintGCDetails -XX:+PrintGCTimeStamps -XX:+PrintHeapAtGC -verbose:gc -Xloggc:cfjvmGC.log
Or this way by editing JVM.CONFIG:
-server -Xms2048m -Xmx4096m -Xmn256m -XX:MaxPermSize=324m -XX:PermSize=192m -XX:+UseParallelGC -Xbatch -Dcoldfusion.home={application.home} -Dcoldfusion.rootDir={application.home} -Dcoldfusion.libPath={application.home}/lib -Dorg.apache.coyote.USE_CUSTOM_STATUS_MSG_IN_HEADER=true -Dcoldfusion.jsafe.defaultalgo=FIPS186Random -XX:+PrintGCDetails -XX:+PrintGCTimeStamps -XX:+PrintHeapAtGC -verbose:gc -Xloggc:cfjvmGC.log
For now it might be advisable to set JVM to perform full garbage collection every 10 minutes but as I post I am undecided so will post again more thoughts on that if it seems more like a good bandaid idea to me. I think stay with UseParallelGC because it tends to keep the heap evacuated rather than alter garbage collector to something that tends to maintain objects in memory.
Java is 7 so not EOL 6 tho fair to say 7u15 is old with 7u67 current. Java 8 is also release however no support statement from Adobe with running CF10 on Java 8. Since you are not using a newer garbage collection algorithim like G1GC (and for now I do not recommend you do) I think stay with 7u15 for now.
HTH, Carl.
Copy link to clipboard
Copied
Carl
I implemented the suggestions you made but unfortunately this does not seem to have had any impact on the availability of the application, for the last couple days I've never had longer than 25-30 minutes up-time 
Copy link to clipboard
Copied
At this point, the key values we wish to know are those of status. You want to know which threads have run completely (status=COMPLETED), which were prevented from running (status=TERMINATED) and which have yet to run (status=NOT_STARTED).
Copy link to clipboard
Copied
I assume these are found in a thread dump?
Copy link to clipboard
Copied
I added the sleeper thread that you suggested and the information it gives me on the thread is elapsed time, name, output (which is empty), priority, start time and status. Were you expecting there to be more information?
I check the error logs whenever ColdFusion is grinding to a halt and cannot see any other errors than the GC overhead limit exceeded one, but cfhttp requests are taking 30-40 seconds to return rather than a few hundred milliseconds.
Would anyone be willing to cast their eye over the application on their own development environment to see if they A) encounter the same issue and B) see if they can find what the cause is?
Copy link to clipboard
Copied
You will need to make a copy of cfjvmGC.log since when CF starts a new log is created and existing log with the memory details and garbage collection information lost. The log you attached has 1 full garbage collection at 29 seconds for 0.03
seconds duration with just over 2 minutes of up or log time.
Be sure to save your next log when fail occurs and host that.
HTH, Carl.
Copy link to clipboard
Copied
Carl, had a fail this morning and the log can be found at http://www.filedropper.com/cfjvmgc_1. I'd forgot you'd asked about Java version, details are as follows:
| Java Version | 1.7.0_15 |
| Java Vendor | Oracle Corporation |
| Java Vendor URL | http://java.oracle.com/ |
| Java Home | C:\Services\web\jre |
| Java VM Specification Version | 1.7 |
| Java VM Version | 23.7-b01 |
| Java VM Name | Java HotSpot(TM) 64-Bit Server VM |
BKBK, I'd reduced the sleep time to 5 seconds so all accounts log in okay. I'll implement the suggestion you made and let you know what I find.
Copy link to clipboard
Copied
As for finding out what Java version is in use, in CFadmin select System Information i button. What are the details EG:
JVM Details
Java Version 1.7.0_51
Java Vendor Oracle Corporation
Java Vendor URL http://java.oracle.com/
Java Home D:\Program Files\Java\jdk1.7.0_51\jre
Java VM Specification Version 1.7
Java VM Version 24.51-b03
Java VM Name Java HotSpot(TM) 64-Bit Server VM
Regards, Carl.
-
- 1
- 2

Find more inspiration, events, and resources on the new Adobe Community
Explore Now
 AdChoices