

- Home
- ColdFusion
- Discussions
- CHTTP Connection Failure inconsistencies CF2021
- CHTTP Connection Failure inconsistencies CF2021
CHTTP Connection Failure inconsistencies CF2021

Copy link to clipboard
Copied
I am trying to create a cfhttp request to our Cisco ISE API server to retrieve endpoint devices in groups. The api is only able to return 100 devices per page and one of the groups has around 15,000 devices in it. When I run a cfhttp command for one response page on a CF page it gets a response within 300-500ms. I then tried creating a loop that would increment the page in url of the cfhttp request 10 times so in theory returning 10 pages of data or 1000 devices worth of data. When I run the cfhttp in a loop, there tends to be requests that fail with a response of connection failure: bad_record_mac.
I am running the page in a Coldfusion 2021 Update 6 server with JDK 11.0.11. This being ran on a developer build on my local machine but similar issues show on our development server which is an enterprise build.
Things I have tried:
- Downloaded cert from https site using chrome and inserted it into keystore (currently removed as it didn't seem to change anything when added)
- Added timeout of 2 seconds to cfhttp so that it would time itself out and try again quicker
- Updated JDK version to 11.0.19 (Current version installed now)
- Error detail now states Connection Exception: Connect to server.domain.org:port# failed: COnnection timed out: connect
- Created a python script that does the same call to the API server but it returns a Status 200 for larger loops without ever having any connection errors. This points me towards a setting or issue with CF Server and how it is processing the connection/request.
I did do a full run to get all the data on 20K devices (200 pages/requests) and there were around 1,500 failed connection requests before I got all the 200 correct responses back.
Here is a sample of the code I was using:
<cfsetting requestTimeOut = "600" />

<cfset groupID = '11111111111'>

<cfset successful = 0>
<cfset failed = 0>
<cfset page = 1>
<cfloop condition="#page# LTE 10">

			<cftry>
			<cfhttp url="https://server.domain.org/ers/config/endpoint?size=100&filter=groupId.EQ.#groupID#&page=#page#" method="get" result="resultPage" username="user" password="password" port="portNum">

				<cfhttpparam type="header" name="Content-Type" value="application/json" />
			    <cfhttpparam type="header" name="Accept" value="application/json"  />
			</cfhttp>


			<cfif resultPage.Statuscode EQ "200">
				<cfset page = page + 1>
				<cfset successful = successful + 1>
			<cfelse>
				<cfset failed = failed + 1>
				<cfdump var="#resultPage#" >
			</cfif>

			<cfcatch >
				<cfdump var="#cfcatch#" >
			</cfcatch>

			</cftry>
			<cfoutput>page = #page#<br/></cfoutput>
</cfloop>


<cfoutput >
	Succesful = #successful# <br/>
	Failed = #failed# <br/>
</cfoutput>
Is there any other suggestions on what could possibly cause these issues? It doesn't seem to be very consistent.


 6
Replies
6
6
Replies
6

Copy link to clipboard
Copied
I'm inclined to think it's a Java error rather than a cf one. Good that you tried updating Java, but since it only made things worse, here's what I'd suggest next. Get details of the error by adding:
-Djavax.net.debug=allto the java.args line (in cf's jvm.config file, in cfusion/bin), the restart cf. I recommend that over editing the args in the cf admin, because if you make a mistake there and cf won't start, you won't be able to revert or change it there.
This will generate a lot of diagnostics for each cfhttp call (to cf's logs), but on your local dev server at least you won't have to wade through data from requests triggered by other folks.
From my looking into that error, it seems to suggest a mismatch of tls/SSL versions between your cf (Java) and the destination server. There are jvm args that can specify the version to use (rather than leave it to negotiate). Again the debug info will show details of that, and perhaps what it's tripping over.
Finally, as for the seeming random failures, it could be that the server your calling has a load balancer, and sometimes your call goes to one server or another. They may not be identically configured. Again, the debug diags may even reflect that, if they vary greatly for the working vs failing calls.
There at least are some things to start with.
/Charlie (troubleshooter, carehart. org)
Copy link to clipboard
Copied
Charlie,
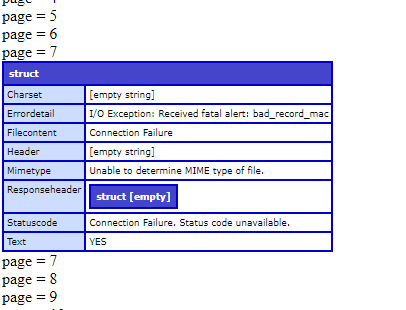
I added the line to the jvm.config file and restarted the server. In the coldfusion log "coldfusion-out.log" I was able to see at what times the requests were sent and when there was a successful request completed. It failed to get a response back when trying to get page 6 in this instance 5 times before it got a successful response which appears to have taken longer than the normal responses before it. Here is what that looked like:

I then checked in the "coldfusion-error.log" file to try and match up the failed requests with the information there. It appears that the cfhttp requests are only logged in this file when the http request completes. So, the data there goes from the time 19:54:34 then jumps to 19:56:35.
Here is what the log looked like at that instance:

I will admit that I am not sure what I should be looking for exactly in the log files though. I couldn't find any information on what server it was connecting to in the data. I did see that it is using TLSv1.2 when connecting though.
It seemed to run better today with less errors when nobody is in the school district on the network so maybe it is related to some sort of load balancer issue. I may need to get with the admin who manages the CF Server and also the ISE server to see if they know anything about any load balancer when we return to the office on Wednesday.
Copy link to clipboard
Copied
Sorry I realized I posted the wrong screenshot on the second part showing that it went from 19:54:34 to 19:56:34 in the error.log file. I didn't see a way to modify or edit my previous post so here is the correct screenshot.


Copy link to clipboard
Copied
I'm just skimming this basically, but it looks like you have two successfully completed CFHTTP requests. The first is taking about 370 milliseconds, and the second is taking 15000 milliseconds. I think that may be breaking the code snippet you posted, which has a timeout of 600 milliseconds. That might be the root cause of your problem.
Dave Watts, Eidolon LLC
Copy link to clipboard
Copied
Dave,
The cfsetting request timeout is in seconds and was used so the page would timeout after 10 minutes if it wasn't able to succeed. This was needed when running the larger loops as the page was timing out before getting all the data responses back as it loops the same request if it fails or timeouts.
The CFHTTP requests themselves appear to timeout at 20 seconds as that is time between the 5 failed requests that did not receive any response back. The 15000 ms one was longer than expected as most of the succesful attempts are usually between 300-400 ms.
Thank you for the response but unfortunately I don't think this is part of problem.
Copy link to clipboard
Copied
You're absolutely right about the CFSETTING REQUESTTIMEOUT attribute! I don't know why I thought it was milliseconds. I'd be a little worried about your CFHTTP taking fifteen seconds to work sometimes. But you're right, that's not the root cause of your problem. Sorry about that!
Dave Watts, Eidolon LLC

Get ready! An upgraded Adobe Community experience is coming in January.
Learn more
 AdChoices