Please refer to the code below, and see the output difference between 2016 vs. 2010
Below are the issues in 2016
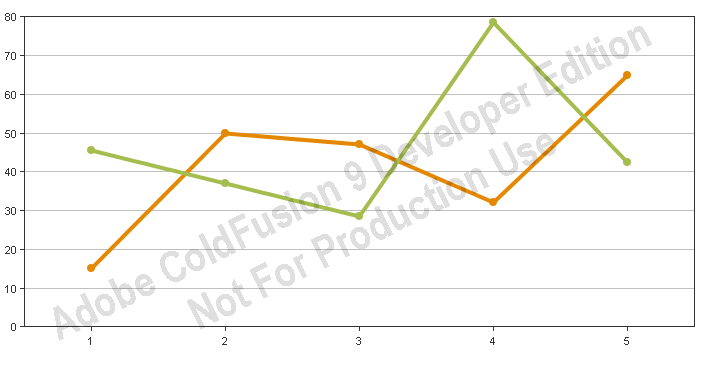
1) When there is a missing value, it moves all the axis values to previous points... for example.. look at second chart series in the code
2) The chart doesn't plot on the value items mentioned in the series, doesn't start from 1... instead defaults it to zero.
<cfchart format="png" chartheight="350" chartwidth="700">
<cfchartseries type="line" serieslabel="Cost per Clicks">
<cfchartdata item="1" value="15">
<cfchartdata item="2" value="50">
<cfchartdata item="3" value="47">
<cfchartdata item="4" value="32">
<cfchartdata item="5" value="65">
</cfchartseries>
<cfchartseries type="line" serieslabel="Cost per Registration">
<cfchartdata item="1" value="45.52">
<!---<cfchartdata item="2" value="17.68">--->
<cfchartdata item="3" value="28.50">
<cfchartdata item="4" value="78.62">
<cfchartdata item="5" value="42.50">
</cfchartseries>
</cfchart>
Coldfusion 2010
Coldfusion 2016

Message was edited by: Rajkumar Chidambaram: re uploaded the images


 1
Reply
1
Reply


 AdChoices