Need help with CF Performance Monitoring Toolkit
Copy link to clipboard
Copied
Hi everyone, recently our CF server been having some performance issues so I was tasked to install the PMT for monitoring and troubleshooting. After installing and setup the PMT server on a seperate VM. I was able to connect the 2 servers sucsessfully. However, when I check the metrics inside PMT dashboard, the stats are all showing 0.
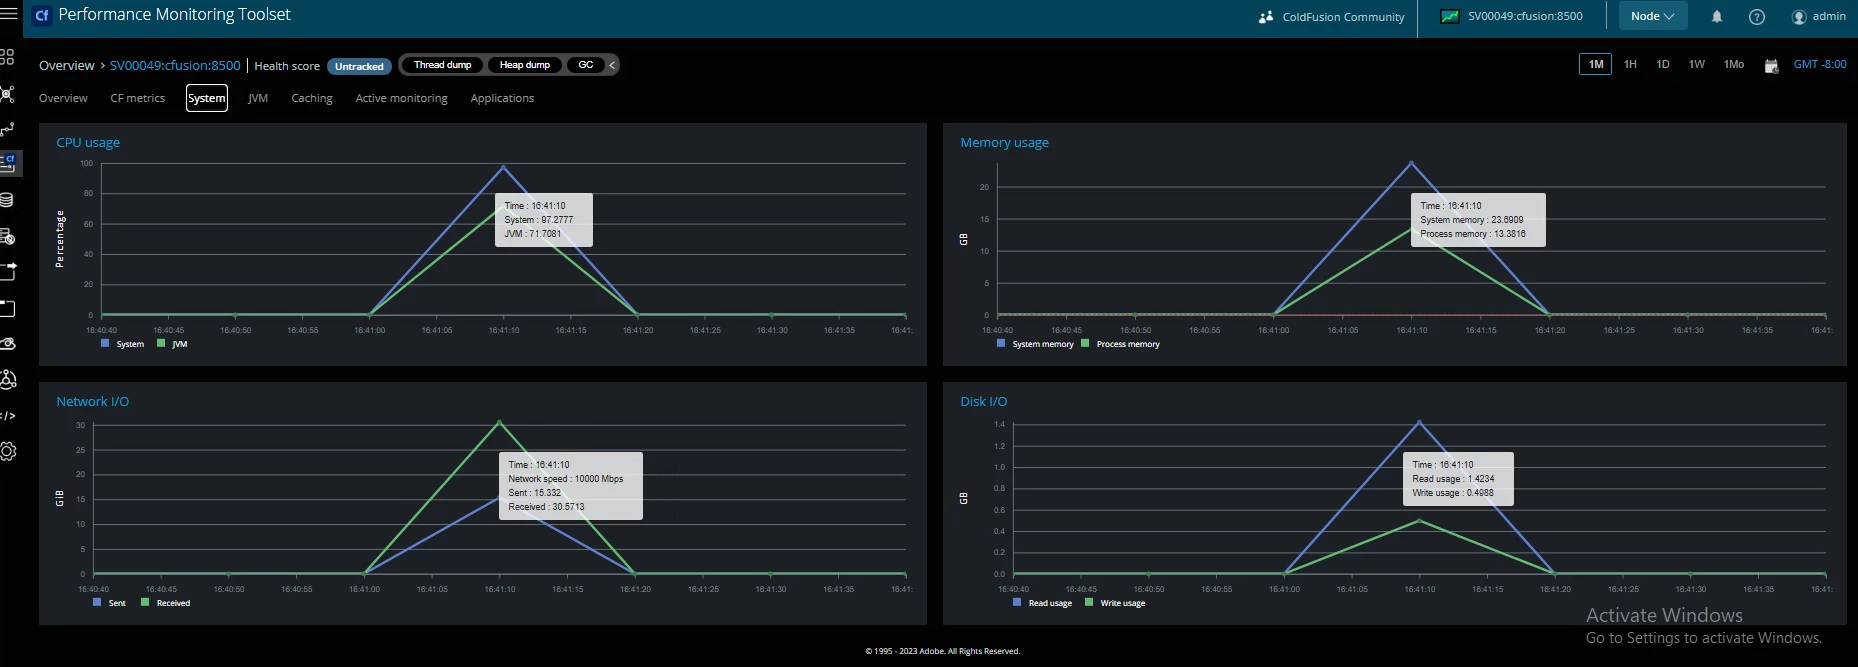
One thing I noticed is the metrics show up for a few seconds whenever I reboot the PMT server but immediately goes to 0 until next time I restart the service.
I have tried completely reinstalling Windows and PMT server and the issue is exactly the same.
I have tried to look for some setup guide online but seems to be very limited and I cannot find anything that explains the full setup procedure incase I did something wrong.
 
Copy link to clipboard
Copied
The setup of the pmt can indeed be challenging. First, the pmt service and data store (which I assume you mean are both on the other machine) need to each be reachable from the cf server. Further, the machine in which they are installed needs to have several gigs of free memory before being installed...and perhaps may prove to need still more depending on the traffic to the cf server (or servers) being tracked by that pmt implementation.
As far as the success or failure of that communication into the pmt--as well as the operation of its two components, those are tracked in the various logs for the pmt and pmt datastore.
And note that the datastore is indeed what cf talks to directly, so don't presume it's only the pmt talking to the datasttore.
As for the seeming brief ability for the pmt to show data before it's restarted, that could reflect either the pmt or more likely the datastore running out of resources (memory), which again may be reflected in the pmt and/or datastore logs.
Hope those generic tips help. If you "just want to solve things", I can offer direct consulting help (carehart.org/consulting), but otherwise perhaps I or others here will be able to help based on info you may share, in back and forth over time.
/Charlie (troubleshooter, carehart. org)
Copy link to clipboard
Copied
Hi Charlie,
I did try increase the RAM on the PMT/Datastore server to 32GB and it is still behaving the same. The CF server is able to ping the datastore with no issue.
Copy link to clipboard
Copied
One thing I want to correct is when the stats briefly show up it is AFTER I restart the PMT service. I did not restart the datastore service.
Copy link to clipboard
Copied
One more thing I'll add: it may seem counter-intuitive, but if indeed the pmt or dataatore are running out of resources, note that FusionReactor could be implemented on that server (running those) to watch them.
FR is not just a monitor of CF (or Lucee) but indeed ANY Java application, including the pmt, cf's solr and pdfg services, and much more.
And it has a free 14-day trial (fusion-reactor.com), so there's little reason not to consider it, as a possibly valuable resource to find whatever may be amiss with the pmt and/or datastore.
/Charlie (troubleshooter, carehart. org)
Copy link to clipboard
Copied
Some suggestions:
1. Make sure you install the version of Performance Monitoring Toolkit (PMT) that is compatible with your ColdFusion version. Hence PMT 2023 on CF 2023, PMT 2021 on CF 2021, and so on. (Incidentally, what is your ColdFusion version and update level?)
2. Before you install PMT, ensure that ColdFusion has all the packages needed to integrate with PMT. One way to ensure this on CF 2021 and CF 2023, in particular, is simply to install all the packages.
Steps to install all packages on CF 2021, for example:
(a) Open the command prompt (CMD) as administrator;
(b) Use the DOS command CD to navigate to C:\ColdFusion2021\cfusion\bin;
(c) Type cfpm.bat and press ENTER. That should bring up ColdFusion's Package Manager tool;
(d) Type install all and press ENTER. When ColdFusion finishes, type quit and press ENTER;
(e) Close the CMD window;
(f) Restart ColdFusion 2021.
3. If you google "performance monitoring toolset" you will find useful information on its installation. You will find the following installation guidelines, for example:
Here are further useful guidelines, once you are up and running:
Copy link to clipboard
Copied
Hey our CF is 2023 update 7, and PMT is 2023.0.0.330120
PMT monitoring package is installed in CF package manager, as I can see it showing everything connected in the PMT settings page.
 
Copy link to clipboard
Copied
The settings look OK.
Copy link to clipboard
Copied
I was able to connect the 2 servers sucsessfully. However, when I check the metrics inside PMT dashboard, the stats are all showing 0.
By Jimmy387770720y4n
Upon reviewing this, I am beginning to think that something is amiss. You say the stats are all showing 0. However, from the picture you've attached, the stats for Memory, CPU, Disk I/O and Network I/O are not 0. So, what do you mean by "the stats are all showing 0"?
When you have a typical ColdFusion application, the three main dashboards you will frequently look at are Overview, CF Metrics and Applications. So let's do a test and see what those dashboards tell us.
Launch several CFM pages. Their content doesn't matter. In fact, blank CFM pages will do. What's important is to get the ColdFusion application to run.
Then click, in turn, on the dashboard menus Overview, CF Metrics and Applications.What do you see? Remember to scroll each time. Can you please share the printscreens?
Copy link to clipboard
Copied
Can I ask how you were able to get PMT to monitor instances that are on a different server? I had it working here once and have not been able to get it working since.
Thanks
Forrest
Copy link to clipboard
Copied
Forrest, a key thing is that the cf server needs to be able to reach the server where the pmt datastore is implemented, as I noted in my first reply to Jimmy above in July.
And that means specifically being able to reach the port the ds is listening on, so a ping test alone does not suffice. The default is 9200, but you can also find the port it's listening on in its logs, which might also indicate possible errors.
And you may need to configure any firewall that's protecting the pmt server (whether one on the server itself or in its network) to ALLOW that incoming call from that CF server, to access that port.
Let us know if this gets you going. If not, check out the pmt and ds logs.
And if you still struggle to get it working, I'll repeat the two suggestions I'd offered Jimmy in that July reply:
First, consider implementing fusionreactor to monitor the pmt and datastore (even just using its free trial) to assist in seeing what's going on within those Java-based services. I've done it and it's helped. Even if long-term you prefer to use the pmt rather than FR to monitor cf, I'm simply proposing using it to help setup the pmt, counterintuitive though that may seem to some ears. 🙂
Second and finally, I can help directly (over remote screenshare) and likely quite quickly. You won't pay for any time you don't find valuable. More at carehart.org/consulting.
/Charlie (troubleshooter, carehart. org)
Copy link to clipboard
Copied
We got it working once, then my ISP changed my service and modem/router and it has not worked since.
Basically the issue is that I need a way to have traffic coming in to my public IP be able to reach the PMT datastore. Before it worked by setting up separate network bind host and separate network publish host, but that no longer works. For whatever reason when PMT tries to connect to a cf instance, it is telling the instance to use my internal IP even though it is set up using the external IP for publishing.
I tried a bunch of things and none work. So I need a networking guru to tell me how I can just run PMT and the datastore on my internal IP, and have all traffic that comes in to my external IP on the PMT ports be directed to my internal IP. I used my router do do this for web traffic but it is not working for PMT traffic, most likely because PMT keeps telling the instances that the datastore is at my internal IP. My external IP can be reached using curl and port 9250 from the cfserver, but I can't seems to get the cf instances to use that IP, even if I manually change it by editing the neo-monitoring.xml files and restarting the instance. We just don't have enough resources on the cf server to run everything there.
I might try the FR trial as a temp solution to debug slow queries that need fixed.
Copy link to clipboard
Copied
Forrest, I can't tell if you're saying you need a network expert because you think my help won't suffice or you feel you need someone on-site. Either way, I'll leave you then with a couple more resources to help you.
First, Adobe offered a webinar a few years ago, and it covered the kind of challenges and details you seek. Perhaps it will help you or whoever you hire to connect the dots successfully. It's at https://youtu.be/QNmIjvu50Tw. And there was an Adobe blog post about it back then where I'd added as a comment some additional observations about the recording (including a TOC).
Second, I also addressed aspects of your challenge in my reply on another PMT thread here that might help.
As I communicate in all 3 places, when it comes to the pmt being on a machine separate from cf, it can indeed be challenging to connect all the dots/get all your ducks in a row. The resources I shared should really help those who prefer to go it alone.
/Charlie (troubleshooter, carehart. org)
Copy link to clipboard
Copied
OK I have been digging into the issue I am having with PMT and here is what I found.
PMT requires the package pmtagent to have been installed for each instance that you want to monitor. All of our instances had their core and all packages updated to the latest versions.
BUT no attempt to connect an instance was successful and I blamed the separate networks issues. With the help of Claude AI we dug deeper into the logs and discovered this:
Install of pmtagent reports success from admin package manager. But each restart of the instance shows this in the exception log:
"Error","main","12/22/24","06:48:12","","Unable to install pmtagent package: java.lang.NullPointerException"
java.lang.NullPointerException
at coldfusion.monitor.datastore.JSONConverter.getAllNodes(JSONConverter.java:75)
But in the cpm audit log from when the package was installed we see this:
"Information","main","12/22/24","06:48:07","","Deploying bundle : pmtagent"
"Information","pool-23-thread-1","12/22/24","06:48:07","","Installing the package : C:/ColdFusion2021/bundles/repo/slf4j-api-1.7.12.jar"
"Information","pool-23-thread-1","12/22/24","06:48:07","","Installing the package : C:/ColdFusion2021/bundles/repo/slf4j-log4j12-1.7.12.jar"
"Information","pool-23-thread-1","12/22/24","06:48:07","","Installing the package : C:/ColdFusion2021/bundles/repo/commons-net-3.6.jar"
"Information","pool-23-thread-1","12/22/24","06:48:07","","Installing the package : C:/ColdFusion2021/bundles/repo/disruptor-3.3.7.jar"
"Information","pool-23-thread-1","12/22/24","06:48:07","","Installing the package : C:/ColdFusion2021/bundles/repo/joda-time-2.8.jar"
"Information","pool-23-thread-1","12/22/24","06:48:07","","Installing the package : C:/ColdFusion2021/bundles/repo/lucene-core-analyzers-common-6.6.1.jar"
"Information","pool-23-thread-1","12/22/24","06:48:07","","Installing the package : C:/ColdFusion2021/bundles/repo/lucene-queries-6.6.1.jar"
"Information","pool-23-thread-1","12/22/24","06:48:07","","Installing the package : C:/ColdFusion2021/bundles/repo/lucene-analyzers-smartcn-6.6.1.jar"
"Information","pool-23-thread-1","12/22/24","06:48:07","","Installing the package : C:/ColdFusion2021/bundles/repo/lucene-backward-codecs-6.6.1.jar"
"Information","pool-23-thread-1","12/22/24","06:48:07","","Installing the package : C:/ColdFusion2021/bundles/repo/lucenedemo-6.6.1.jar"
"Information","pool-23-thread-1","12/22/24","06:48:07","","Installing the package : C:/ColdFusion2021/bundles/repo/lucene-grouping-6.6.1.jar"
"Information","pool-23-thread-1","12/22/24","06:48:07","","Installing the package : C:/ColdFusion2021/bundles/repo/lucene-join-6.6.1.jar"
"Information","pool-23-thread-1","12/22/24","06:48:07","","Installing the package : C:/ColdFusion2021/bundles/repo/lucene-memory-6.6.1.jar"
"Information","pool-23-thread-1","12/22/24","06:48:07","","Installing the package : C:/ColdFusion2021/bundles/repo/lucene-highlighter-6.6.1.jar"
"Information","pool-23-thread-1","12/22/24","06:48:07","","Installing the package : C:/ColdFusion2021/bundles/repo/lucene-misc-6.6.1.jar"
"Information","pool-23-thread-1","12/22/24","06:48:07","","Installing the package : C:/ColdFusion2021/bundles/repo/lucene-sandbox-6.6.1.jar"
"Information","pool-23-thread-1","12/22/24","06:48:07","","Installing the package : C:/ColdFusion2021/bundles/repo/lucene-queryparser-6.6.1.jar"
"Information","pool-23-thread-1","12/22/24","06:48:07","","Installing the package : C:/ColdFusion2021/bundles/repo/lucene-spatial3d-6.6.1.jar"
"Information","pool-23-thread-1","12/22/24","06:48:07","","Installing the package : C:/ColdFusion2021/bundles/repo/lucene-spatial-6.6.1.jar"
"Information","pool-23-thread-1","12/22/24","06:48:07","","Installing the package : C:/ColdFusion2021/bundles/repo/lucene-spatial-extras-6.6.1.jar"
"Information","pool-23-thread-1","12/22/24","06:48:07","","Installing the package : C:/ColdFusion2021/bundles/repo/lucene-suggest-6.6.1.jar"
"Information","pool-23-thread-1","12/22/24","06:48:07","","Installing the package : C:/ColdFusion2021/bundles/repo/jna-5.6.0.jar"
"Information","pool-23-thread-1","12/22/24","06:48:07","","Installing the package : C:/ColdFusion2021/bundles/repo/jna-platform-5.6.0.1.jar"
"Information","pool-23-thread-1","12/22/24","06:48:07","","Installing the package : C:/ColdFusion2021/bundles/repo/threetenbp-1.3.6.jar"
"Information","pool-23-thread-1","12/22/24","06:48:07","","Installing the package : C:/ColdFusion2021/bundles/repo/oshi-core-5.3.7.jar"
"Information","main","12/22/24","06:48:07","","Installing the package : C:/ColdFusion2021/bundles/perfmon-2021.0.17.330334.jar"
Also it seems like some other packages installed during the update did not actually install, even on another server running 2023 (we are running 2021). For exampe caching module is installed but running a query with cachedwithin throws this error:
Cache initialization failed due to following reason: Error configuring from null. Initial cause was Cannot invoke "java.net.URL.openStream()" because "url" is null
If you look at this list of required jars and compare to the audit log you will see a few jars are not installed when the bundle is installed, in particular the elasticsearch bundles and sniffer. And when we try to add an instance to PMT all we get is errors when the cf server tries to talk to the datastore. slf4j-api-1.7.12 , slf4j-log4j12-1.7.12 , commons-net-3.6 , disruptor-3.3.7 , joda-time-2.8 , lucene-core-analyzers-common-6.6.1 , lucene-queries-6.6.1 , lucene-analyzers-smartcn-6.6.1 , lucene-backward-codecs-6.6.1 , lucenedemo-6.6.1 , lucene-grouping-6.6.1 , lucene-join-6.6.1 , lucene-memory-6.6.1 , lucene-highlighter-6.6.1 , lucene-misc-6.6.1 , lucene-sandbox-6.6.1 , lucene-queryparser-6.6.1 , lucene-spatial3d-6.6.1 , lucene-spatial-6.6.1 , lucene-spatial-extras-6.6.1 , lucene-suggest-6.6.1 , jna-5.6.0 , jna-platform-5.6.0.1 , elasticsearch-rest-client-5.6.16 , elasticsearch-5.6.16 , threetenbp-1.3.6 , oshi-core-5.3.7 , sniffer-5.3.2
Is there something wrong with the CF 2021 package installer? I saw ther posts about errors and loss of admin access (thanks Charlie) related to java version but we are running version 11.0.1
Thanks. I really need to figure this out since I think none of the packages that were updated actually got installed (and this was all of them)
Copy link to clipboard
Copied
@forrestmahannah , you are right. There seems to be something wrong with the installation of packages in ColdFusion 2021.
The same issue emerged in a recent discussion about packages failing to install during a ColdFusion 2021 update. I offered a possible solution there. Try it and let us know how it goes.

