 Adobe Community
- Home
- ColdFusion
- Discussions
- Re: CF 11 Adobe ColdFusion Launcher Application- M...
- Re: CF 11 Adobe ColdFusion Launcher Application- M...
CF 11 Adobe ColdFusion Launcher Application- Maxing out CPU memory

Copy link to clipboard
Copied
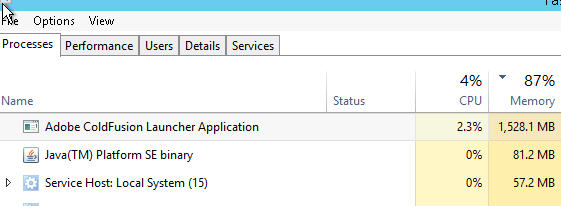
I have installed the Coldfusion 11 Standard Edition in Windows Server 2012 R2 with 2GB RAM and IIS 8.5. “Adobe ColdFusion Launcher Application” exe consumes more CPU memory in the process say around 86% and slows down or stops running the Application. The Application services goes down and URL throws Service unavailable error. Please help.


 18
Replies
18
18
Replies
18

Copy link to clipboard
Copied
This depends on a number of things. The memory being used is what the JVM is set to. You can see this by going into the CF admin and choosing the JVM option from the menu. I think the default minimum is 1024MB which is 1GB or 512MB.
Then it depends on what you are running in the application. Is this amount of memory enough for what you want to do? The 86% is not just CF, that is also the other applications, including OS processes, using the memory. The recommended requirements to run Server 2012 is 2GB alone, not leaving much for other processes to use.
If CF doesn't have enough memory to do what its doing then it will eventually starve and the process will die.

Copy link to clipboard
Copied
Hi Prakash,
Could you please share your contact details to cf.install@adobe.com. Also please share the C:\ColdFusion11\cfusion\logs folder zip.
Copy link to clipboard
Copied
Hi Prakash,
For your email, one of our team members is working on this issue.
Thank You,
Abhishek

Copy link to clipboard
Copied
Hi Abhishek
I too have almost exactly the same issue although the percentage is 87%. We also have a great deal more memory and no matter how much we throw at it, the percentage remains basically the same. Also even when we restart ColdFusion, immediately it comes back it shoots straight up to 87%, with no users or processes interacting.
Has a solution been found for Prakash?
Thanks
Barb
Copy link to clipboard
Copied
What is your min and max memory settings set to for the CF JVM?
This usage could be normal depending on what you have configured.
Copy link to clipboard
Copied
The settings are for both Min and Max are 1024.
Copy link to clipboard
Copied
How much memory does the server have?
Copy link to clipboard
Copied
The server has 3.5GB of memory and is utilised as the ColdFusion only server. Database is on a a different server.
Copy link to clipboard
Copied
What you posted looks about right then. Your CF instance is using about 40-42% of the servers memory, and as you have 2012 installed (which requires a recommended 4GB to run) the rest of the OS and applications are probably using up the other 45%
You have min set to 1024, so its going to use that straight away when you fire up the server. Which is why things go right up to 87% mark straight away.
Copy link to clipboard
Copied
Is there any benefit in having the min and max set to the same amount to allow that automatic high memory usage straight off? This was a setting I found not one I had set myself.
Copy link to clipboard
Copied
It is what comes as default. You can lower the min setting to say 512 but it depends on what you application does. 1024 is usually sufficient enough for the basic of apps. I thought 512 was the default min amount, but it may have gone up. Also note, these days, the amounts set are not classed as "high". Your server is pretty low specced for a Windows 2012 server. Again it depends on what your application does though and what else is going on with the server.

Copy link to clipboard
Copied
We are also seeing this issue on two new web servers running CF 2016 Standard. The servers have 4 cores and 14GB memory.
We were getting "out of memory" errors from the Java garbage collector with the default heap size (512MB min, 1GB max), so I upped the max heap memory to 10GB. That fixed the "out of memory" errors, but we are still seeing the very high CPU utilization.

Copy link to clipboard
Copied
What is you app doing when it showing this CPU? Do you look at the CF server monitor or use any third parties like FusionReactor? The server monitor alone though be able to tell you what page / thread is running if there are any.
Usually CPU that high is because CF is trying to do something. For example, image processing etc, something intensive.
On a side note, do you use load balancers in front of these two servers?
Copy link to clipboard
Copied
We do not have any third party tools installed. The site uses basic CF, though it does generate a lot of charts. We did not have the same problem with CF11.
I would understand if the activity were spiky, but it's almost constant at 80-90% CPU, which is not usually normal for most applications. There aren't that many users and user activity on the server is not constant.
The two servers are behind a load balancer.
Copy link to clipboard
Copied
Are you able to see in the CF Server monitor if there is anything running that would cause the CPU.
Does the high CPU happen on both servers? Are you able to take one of the servers out of the load balancers? We had an issue with CF 11 with our load balancers. When we were forwarding web socket traffic to the servers the CPU on CF would get really high for some reason.

Copy link to clipboard
Copied
Hi,
Could be CF is consuming CPU still due to Java GC related matters. On 64 bit it can be fair to say that -XX:MaxMetaspaceSize=192m is small. Since you seem interested in applying some Java related changes to tune CF and you have available memory (from my read server has 14Gb) perhaps make that bigger.
While you consider that it can be wise to set an initial value as well. EG
-XX:MetaspaceSize=312m -XX:MaxMetaspaceSize=512m
Note CF will need a restart to apply Java changes.
HTH, Carl.
Copy link to clipboard
Copied
Thanks for the info Carl.
I did some research on the Java metaspace and increased the max metaspace size to 4g and set the minimum size to 256m (-XX:MetaspaceSize=256m -XX:MaxMetaspaceSize=4g).
There's plenty of available memory on the server, so these values shouldn't be a problem from a resource perspective. Whether Java works well with those settings is another story...
I'll let it run in this config and see if resolves the high CPU utilization.
Copy link to clipboard
Copied
welcome tho small wince from me with -XX:MaxMetaspaceSize=4g.
Not to be missed in your Java 8 research but less likely to be consuming CPU is what are the default values when not defined on 64 bit in JVM.CONFIG or CFadmin > Server Settings > Java and JVM > JVM Arguments for -XX:ReservedCodeCacheSize= -XX:CompressedClassSpaceSize= ? I will try help CodeCache is 240Mb and CompressClass is 1Gb. Hence my wince if Metaspace grew out to 4Gb and heap was well occupied (possible 10Gb from my thread read) you can see if CompressClass was committed with objects available RAM will run out.
Regards, Carl.

 AdChoices