• Global community
    • Language:
      • Deutsch
      • English
      • Español
      • Français
      • Português
  • 日本語コミュニティ
    Dedicated community for Japanese speakers
  • 한국 커뮤니티
    Dedicated community for Korean speakers
Exit
0

CFCHART - limit how many x-axis labels

Participant ,
May 15, 2015 May 15, 2015

Copy link to clipboard

Copied

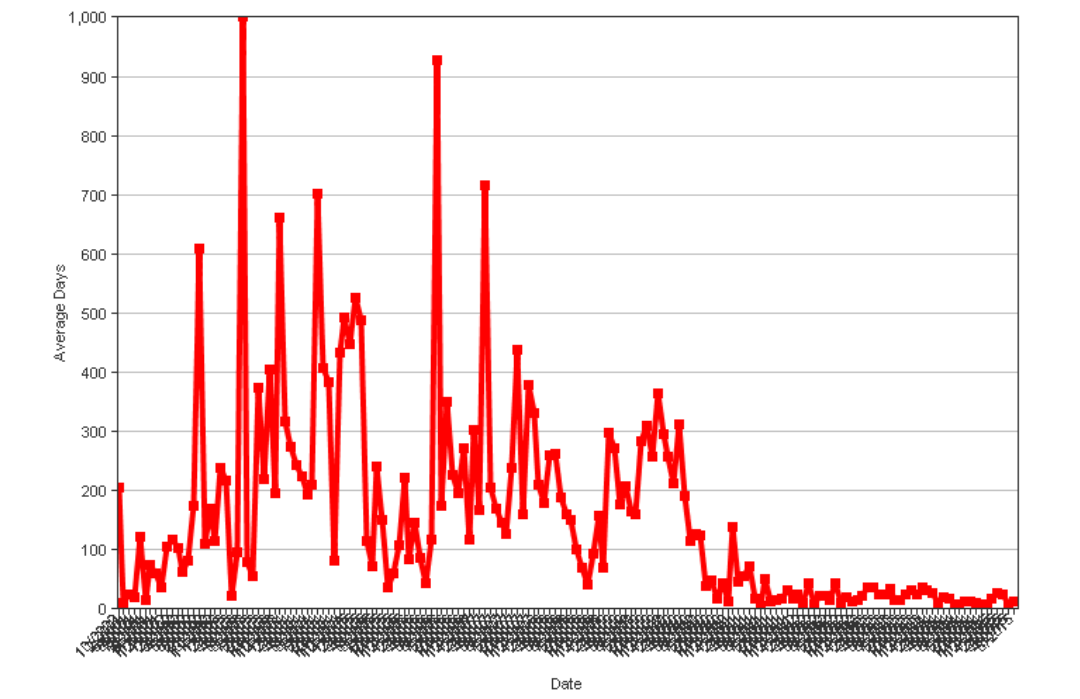
I have a chart that spans many years and lists each month.

I would like to keep the graph and data points listed by month, but maybe only have the axis list the years?  The exact dates aren't important, the trend of the graph is.

Here is an example, clearly the dates are unreadable.

Can this be done?  I'm using CF9.

Thanks

save image

Views

261

Translate

Translate

Report

Report
Community guidelines
Be kind and respectful, give credit to the original source of content, and search for duplicates before posting. Learn more
community guidelines
no replies

Have something to add?

Join the conversation
Resources
Documentation