 Adobe Community
cfchart output by month

Copy link to clipboard
Copied
I'm using CF10.
I want to output a count of events by the month they happened each.
Each month will always have at least 1 event, so I'm not worried about months with 0.
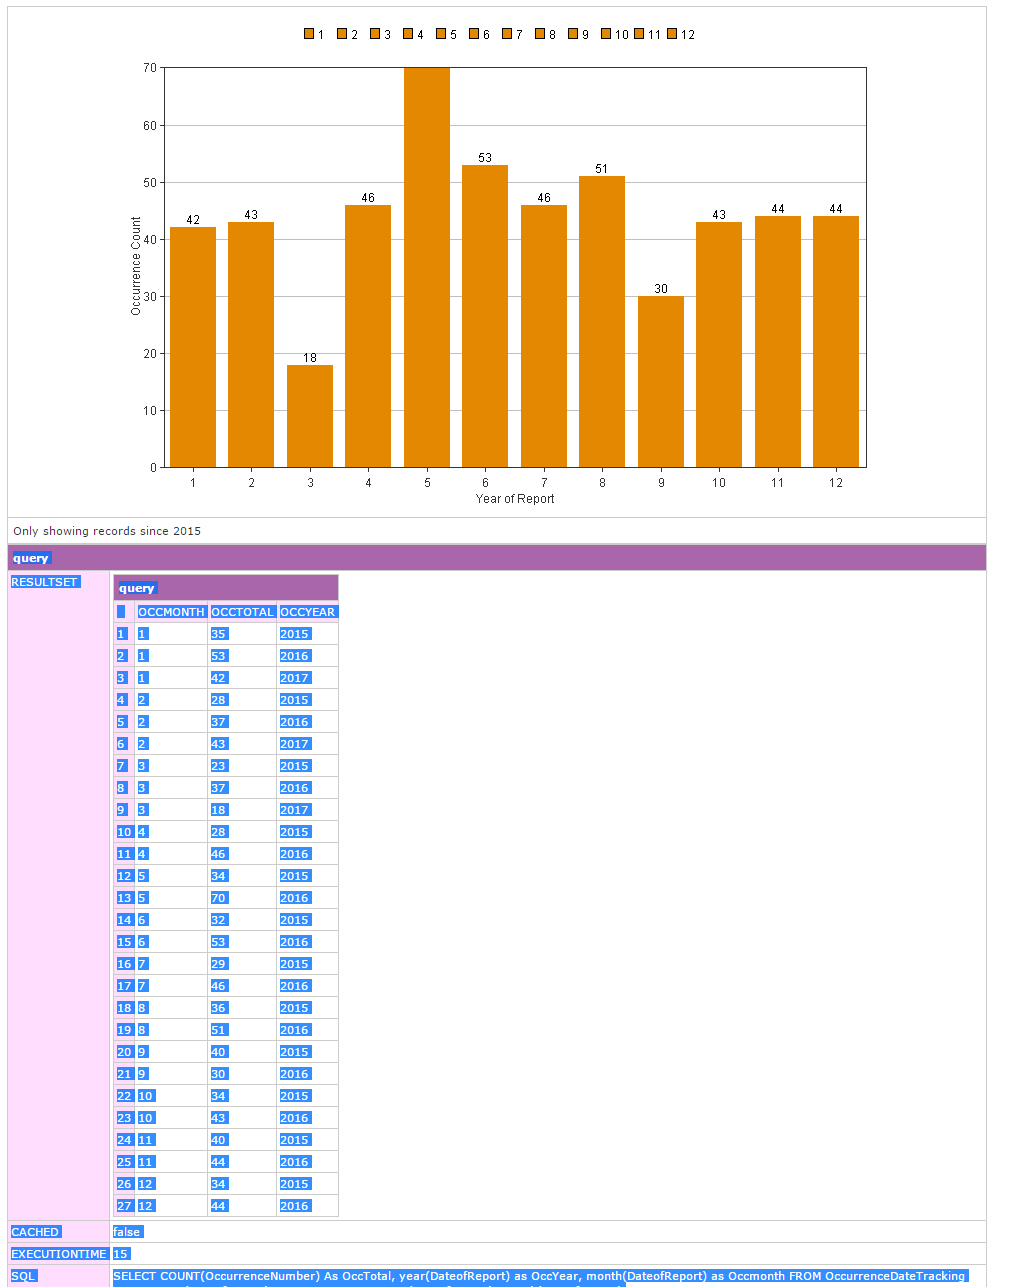
This is showing me the 12 months in order, but adding them up.
The query is retrieving records back through the last 3 years.
Where did I go wrong?
I want to show the months in order for the last three years.
<cfquery Name="OccOpenChart" datasource="#APPLICATION.DSN#">
SELECT
COUNT(OccurrenceNumber) As OccTotal,
year(DateofReport) as OccYear,
month(DateofReport) as Occmonth
FROM OccurrenceDateTracking
WHERE Year(DateofReport) > #thisyear#
GROUP BY year(DateofReport), month(DateofReport)
</cfquery>
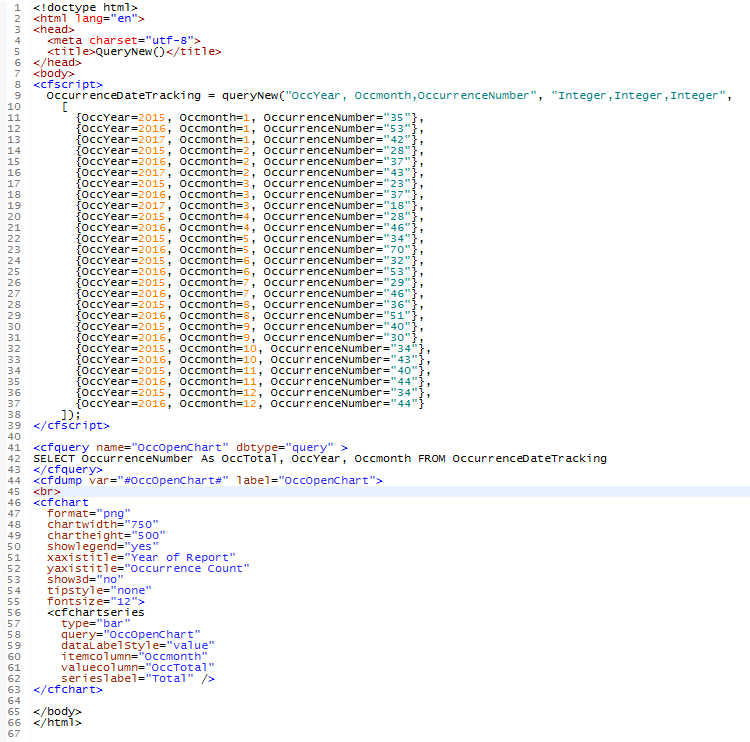
<cfchart
format="png"
chartwidth="750"
chartheight="500"
showlegend="yes"
xaxistitle="Year of Report"
yaxistitle="Occurrence Count"
show3d="no"
tipstyle="none"
fontsize="12">
<cfchartseries
type="bar"
query="OccOpenChart"
dataLabelStyle="value"
itemcolumn="Occmonth"
valuecolumn="OccTotal"
serieslabel="Total" />


 8
Replies
8
8
Replies
8

Copy link to clipboard
Copied
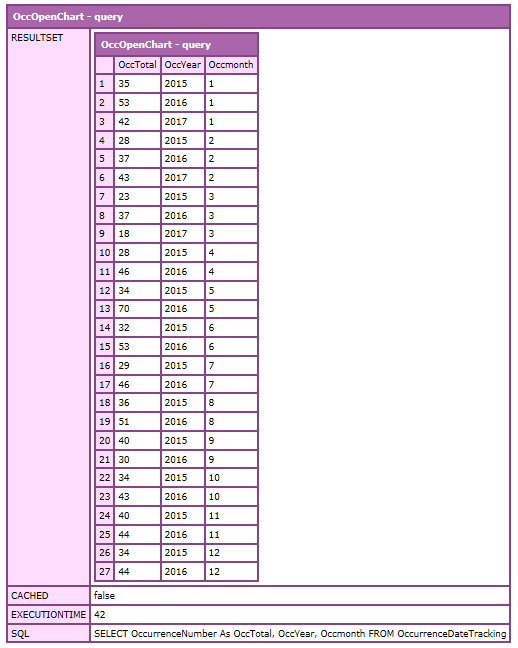
Do the following and post the result:
<cfdump var="#OccOpenChart#">
Cheers
Eddie
Copy link to clipboard
Copied
EddieLotter wrote
Do the following and post the result:
<cfdump var="#OccOpenChart#">
Cheers
Eddie
| query | |||||||||||||||||||||||||||||||||||||||||||||||||||||||||||||||||||||||||||||||||||||||||||||||||||||||||||||||||||||
|---|---|---|---|---|---|---|---|---|---|---|---|---|---|---|---|---|---|---|---|---|---|---|---|---|---|---|---|---|---|---|---|---|---|---|---|---|---|---|---|---|---|---|---|---|---|---|---|---|---|---|---|---|---|---|---|---|---|---|---|---|---|---|---|---|---|---|---|---|---|---|---|---|---|---|---|---|---|---|---|---|---|---|---|---|---|---|---|---|---|---|---|---|---|---|---|---|---|---|---|---|---|---|---|---|---|---|---|---|---|---|---|---|---|---|---|---|---|
| RESULTSET |
| ||||||||||||||||||||||||||||||||||||||||||||||||||||||||||||||||||||||||||||||||||||||||||||||||||||||||||||||||||||
| CACHED | false | ||||||||||||||||||||||||||||||||||||||||||||||||||||||||||||||||||||||||||||||||||||||||||||||||||||||||||||||||||||
| EXECUTIONTIME | 15 | ||||||||||||||||||||||||||||||||||||||||||||||||||||||||||||||||||||||||||||||||||||||||||||||||||||||||||||||||||||
| SQL | SELECT COUNT(OccurrenceNumber) As OccTotal, year(DateofReport) as OccYear, month(DateofReport) as Occmonth FROM OccurrenceDateTracking WHERE Year(DateofReport) > 2014 GROUP BY year(DateofReport), month(DateofReport) | ||||||||||||||||||||||||||||||||||||||||||||||||||||||||||||||||||||||||||||||||||||||||||||||||||||||||||||||||||||
Here's a screenshot of the page
Copy link to clipboard
Copied
bloodbanker wrote
I want to show the months in order for the last three years.
By this do you mean that you want to see the three Januaries first, then the three Februaries etc.?
If so, then you need to switch the expressions in your Group By clause.
Cheers
Eddie
Copy link to clipboard
Copied
Sorry.
Let's say it was the last three calendar years.
I want to display jan - december of 2015 followed by jan-dec 2016 followed by jan - mar 2017.
Copy link to clipboard
Copied
In that case try switching the expressions in your Group By clause and see if you get what you want. If not, try adding an Order By clause. Some database engines will allow an Order By clause that has a different column order from the Group By clause.
Cheers
Eddie
Copy link to clipboard
Copied
Thanks. I tried switching the group by, added an order by, tried switching all of those around.
The dump shows what I want the chart to show, but the chart keeps displaying like it is in the pic.
Copy link to clipboard
Copied
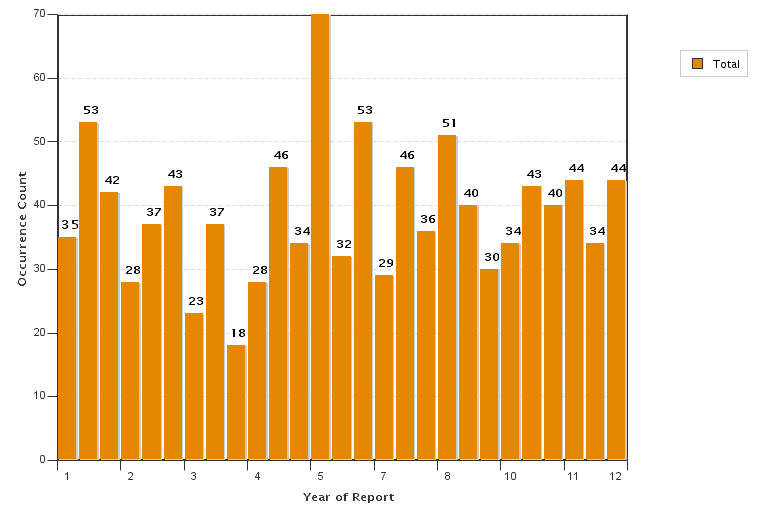
That doesn't seem possible. If you change the query then the chart has to change. If you get the same chart no matter what you do to the query then I suspect the chart is not using the query you think it is, or you are seeing some kind of caching issue.
When I use your data set I get a different chart:
Copy link to clipboard
Copied
Sorry, I meant to say "If not, then you need to switch the expressions in your Group By clause."
In other words, if you switch the expressions then you will get all months in the first year, followed by all months in the next year, and so on.
Cheers
Eddie

 AdChoices