 Adobe Community
ColdFusion 11 Destroyed My Charts

Copy link to clipboard
Copied
Surely we can't be the only ones who are disappointed with the newest charting engine in CF11? Yes, ZingCharts can be cool and the plethora of style options gives us total freedom to build the perfect chart. However, that is also the root of the problem! Since CF8, CFCHART has been adequate for our needs. It produced good looking chart images and was just flexible enough for us to produce what we needed while staying simple enough for us to put together quickly and move on in development. This has been true up through CF10....
We just installed CF11 on our test server and it has DESTROYED every chart we produce using the same code we've had in place for years.
Custom chart colors: gone. Readability: hit or miss. 3D angles and depths: changed. Proper fitting of images in pages: gone. Legends specifically told to hide: now showing, and showing incorrectly. Labels: FUBAR.
What the hell?! Who was in charge of the backward compatibility of this charting engine? The least that should have been done was to give us a default style similar to the old one.
Again, we liked the simplicity the old engine gave us. And, while it would be cool to spend some time with the ZingChart Editor creating super awesome charts, we don't have the time to mess with the minutiae of all the little details for these charts. But it looks like I have no choice. So, instead of proceeding with our upgrade to CF11 we have to stop and reconfigure hundreds of CFCHART tags!
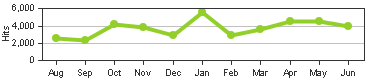
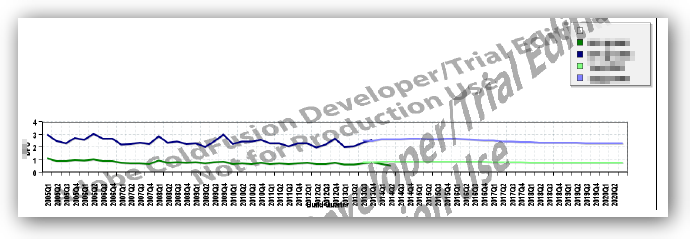
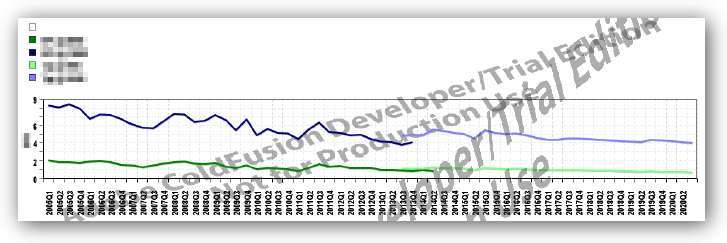
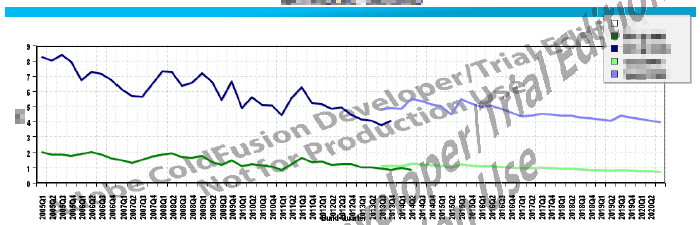
Here are some examples of our mangled charts that have had NO CODE CHANGES from CF10 to CF11:
| CF10 | CF11 |
|---|---|
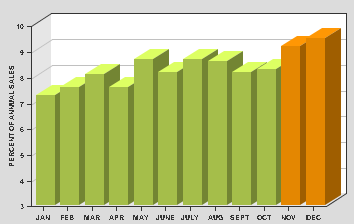 | 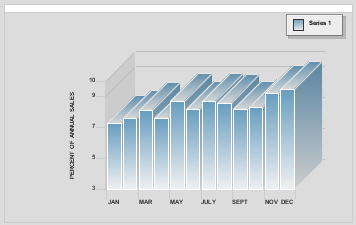 |
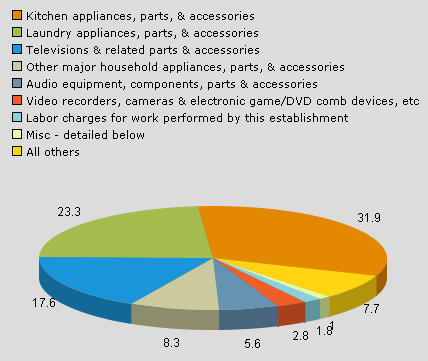 | 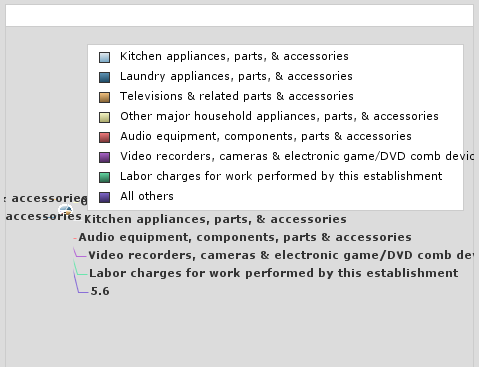 |
 |  |
OK, rant over. Have to waste time fixing this bullsh*t...


 51
Replies
51
51
Replies
51

Copy link to clipboard
Copied
It will be available soon. Thanks for patience and cooperation.
Regards,
Anit Kumar

Copy link to clipboard
Copied
Thanks for working on this. I do like that you've updated the charting engine, I just hate to have to go back through to fix all the existing code...........
I still receive the following error:
Could not locate the style file
My style is set just before my chart because I have to do some math on the record count returned and etc in order to know what width I would like the bars in the graph and etc. So I have a cfsavecontent variable that I store the appropriate information in and then set it in the cfchart tag like so:
style="#style4#"
Maybe this isn't even possible anymore?
Copy link to clipboard
Copied
Can you share the completely repro code, or share the bug# if already logged?
Regards,
Anit Kumar
Copy link to clipboard
Copied
<cfsavecontent variable="style1">
<?xml version="1.0" encoding="UTF-8"?>
<frameChart is3D="false" altText="Summary Reports">
<frame outline="black"/>
<elements shapeSize="<cfoutput>#shapeSize#</cfoutput>" fixedWidth="9" />
<popup background="#666666" foreground="white"/>
</frameChart>
</cfsavecontent>
<cfchart
style="#style1#"
format="png"
scalefrom="0"
scaleTo="#getArticleCountByPestTypeScaleTo.maxScaleTo#"
gridLines="#gridLines#"
chartwidth="930"
chartheight="300"
showLegend="false">
<cfchartseries
type="bar"
paintStyle="plain"
seriescolor="##0078ae">
<cfloop query="getArticleCountByPestType">
<cfchartdata item="#getarticleCountByPestType.pestTypeText#" value="#getarticleCountByPestType.count#">
</cfloop>
</cfchartseries>
</cfchart>
You can see how I use query data to set some elements of the display. Everything works except for the style attribute in the cfchart tag, that throws a file not found error.
Copy link to clipboard
Copied
Is it possible for you to send in JSON styling as opposed to XML? The ability to use a JSON string was supposed to have been restored (BUG: 3859531).

Copy link to clipboard
Copied
Hi,
this might be out of blue, but did you find a way to set the style on the go and then use it, without having to save it in a file?
If so, please let me know. I have the same problem, moving from CF10 to CF11.
Copy link to clipboard
Copied
I did find a work around. There is a utility that you can use to convert your XML to JSON, I then used that rendered JSON to figure out what I need to adjust on the fly. I did have to write it to a file though, which I deleted immediately after displaying the chart.
A quick example:
<cfsavecontent variable="chart1">
{"graphset":[{"legend":{"border-color":"#CCCCCC"}]}
</cfsavecontent>
<!---take the JSON and write it to a file to read in for styling--->
<cffile action="write" file="#ExpandPath('./chart1Style#session.userID#')#" output="#chart1#">
<cfchart
style="chart1Style#session.userID#"
etc etc etc
</cfchart>
<!---delete the chart style file--->
<cffile action="delete" file="#ExpandPath('./chart1Style#session.userID#')#">
ColdFusion provides a utility to convert XML styles (used by the old charting system) to JSON styles (used by the new charting system).
To perform this conversion, you need to use cfchart_xmltojson.bat (or cfchart_xmltojson.sh) available in <cfusion_home>/bin folder:
If you need to avoid writing to a file it seems that you can actually set everything in the attributes of the cfchart tag:
cfchart - ColdFusion, English documentation - Adobe Learning Resources
Copy link to clipboard
Copied
That looks like it works, shinglehouse, but I wasn't thrilled with the idea of making/deleting temporary styling files.
Many of the attributes in the CFChart tag in CF11 now accept Structs for styling. These are what I'm now using to get the look I need. Problem is, exactly format those structs need to be in is not found in the CF documentation for some reason. However, the Zing Charts website has what you want. It is found here: http://www.zingchart.com/docs/json-attributes-syntax/ What you'll find is many of the attributes that accept Structs directly correlate to a ZingChart graph object. For example, plotarea, plot, etc...
So, what I've done is define a style that I need for each individual CFChart attribute I wish to use. Below is an example of a pie chart I've done. After you get a look at the ZingCharts site, you'll see I've only really scratched the surface. Nearly every aspect of the chart can be styled. Use this as a starting point.
<cfset plotarea ={
"adjustLayout"=true,
"alpha"=1,
"margin-top"=5,
"margin-right"=5,
"margin-left"=5,
"margin-bottom"=0
}>
<cfset title = {
"visible"=false,
"backgroundColor"="##dcdcdc"
}>
<cfset border = {
"borderColor"="none"
}>
<cfset legend = {
"visible"=false
}>
<cfset plot = {
"highlight"=false,
"value-box"={
"placement"="out",
"connected"=false,
"text"="%t",
"font-color"="##5A5A5A",
"type"="all"
}
}>
<cfchart
databackgroundcolor="##dcdcdc"
backgroundColor="##dcdcdc"
plotarea="#plotarea#"
title="#title#"
border="#border#"
legend="#legend#"
plot="#plot#"
chartwidth="460"
chartheight="260"
show3d="yes"
name="ret.pieChartchartImg"><!--- style="#prodJSONFile#" --->
<cfchartseries type="pie">
<cfloop query="myqry">
<cfchartdata item="#numberFormat(myqry.perc,'___._')#%" value="#myqry.perc#">
</cfloop>
</cfchartseries>
</cfchart>
Too bad that, out-of-the-box, Adobe's default styles were so WAY off-base with being backward compatible to previous CF versions.
Copy link to clipboard
Copied
This is great, thanks! I also wasn't a fan of writing to a temporary file so I switched my bar graphs over to use the styling as you described above and it works great!
Copy link to clipboard
Copied
Hi,
when I use the xmltojson converter given, it always generates a big set of json strings. When I give just a single xml tag, with some entries in it,
like,
<tag1>
<subtag> bla bla </subtag>
</tag1>
it goes on to create a full list of string. The problem however is that "bla bla" is not found in the whole JSON file at all. Is there something wrong?
Copy link to clipboard
Copied
My guess would be that "bla blah" isn't valid with the new charts. What is your actual xml that you're trying to convert?
It isn't the best tool, as you said, it generates just about every attribute it knows instead of just the few that you're looking to utilize. I had to dig through that large JSON file looking for what I needed. I pulled out those specific pieces and used them as guide for creating my style file and then later on using them inline like the example above by sdsinc_pmascari. Which works really well.
Copy link to clipboard
Copied
Is it just me, or do the bar graph labels on the x-axis still not work very well (Even after Update 3)?

Copy link to clipboard
Copied
Am I understanding that if we upgrade from CF9 to CF11 none of the cfgraph will work?
Is there an option to upgrade to CF11 but continue to use CF9 graphs?
Copy link to clipboard
Copied
No, they're not totally "broken" it is mainly formatting issues that I'm encountering.

Copy link to clipboard
Copied
With Both Update 4 & 5, I have the issue with the line chart, as shown in the original post, where the legend is not put inside the plot area. Instead the plot is squeezed down, with the legend sitting above it. Is there any fix for this? I use CFCHART because I generate PDFs, so the charts need to be generated server-side.
I *need* to have a fix. I've tried all sorts of things in my JSON file, from not having the (pre-updates 4 & 5 ) default of "legend":{"position":"100% 5%","layout":"x1","item":{"font-size":"13","font-family":"Arial Narrow"}}, to trying "legend":{} and even excluding "legend" completely.
ZingCharts website/documentation is no help, as the version they are at put the legend inside the plot area correctly.
Copy link to clipboard
Copied
Can you include a full code sample for us to check out?
Copy link to clipboard
Copied
chart/SC_PDF_lineChart_MX.js
{"graphset":[{"plot":{"marker":{"size":"0"},"value-box":{"text":"","font-size":"13","font-family":"Arial Narrow"}},"tooltip":{"font-size":"13","font-family":"Arial Narrow"},"plotarea":{"border-color":"#000000","border-width":"1"},"legend":{"position":"100% 5%","layout":"x1","item":{"font-size":"13","font-family":"Arial Narrow"}},"scale-y":{"tick":{"line-color":"#000000","line-width":"1"},"color":"black","line-color":"#000000","font-size":"13","item":{"color":"#000000","font-size":"13","font-family":"Arial Narrow"},"line-width":1,"font-family":"Arial Narrow","label":{"color":"black","font-size":"13","font-family":"Arial Narrow"}},"title":{"font-size":"13","font-family":"Arial Narrow"},"scale-x":{"tick":{"line-color":"#000000","line-width":"1"},"color":"black","line-color":"#000000","font-size":"13","item":{"font-angle":-90,"color":"#000000","font-size":"13","font-family":"Arial Narrow"},"line-width":1,"font-family":"Arial Narrow","label":{"color":"black","font-size":"13","font-family":"Arial Narrow"}}}]}
cfm file
<CFCHART
style="chart/SC_PDF_lineChart_MX.js"
name="myChart"
chartWidth="800"
chartHeight="#chartH#"
format="png"
tipStyle = "none"
xAxisTitle="xxx"
yAxisTitle="xxx"
scaleFrom="0"
fontBold="yes"
fontSize="12"
showXGridlines = "yes"
showLegend="yes"
backgroundColor="FFFFFF"
xAxisType="category">
<CFCHARTSERIES type="bar" item......
Copy link to clipboard
Copied
I found that I needed to specifically lay out the position of the legend and the plot area in order to make the legend usable. Using the "tag attributes method" I described above here is a sample of what I did for a pie chart that put the legend at top left.
<cfset plotarea = {
"adjustLayout"=true,
"position"="0px 255px",
"alpha"=1,
"background-color"="##dcdcdc",
"background-color-2"="##dcdcdc",
"margin-top"=5,
"margin-right"=5,
"margin-left"=5,
"margin-bottom"=0,
"height"=260,
"width"=460
}>
<cfset legend = {
"adjustLayout"="true",
"position"="0px 0px",
"margin-top"=5,
"margin-right"=5,
"margin-left"=5,
"margin-bottom"=5,
"backgroundColor"="##dcdcdc",
"shadowColor"="none",
"borderWidth"="0px",
"visible"="true"
}>
Copy link to clipboard
Copied
I'm not even going to start talking about pie charts!!! lol.
I put your suggestions in, and all it did was move the legend to the left, which is what I expected it to do, but it still is above the plot, rather than in the plot.
Uninstalling Update 5, so going back to just base version 11, the chart worked as it should (with my original json)
Stupid Question.... I went from 11 base to Update 4 then Update 5... should I have also installed Updates 1-3?
Copy link to clipboard
Copied
Interesting. Could you not adjust the Plotarea to force the chart to use the full height?
I feel your pain.
Copy link to clipboard
Copied
By George, I've got it.... as someone said...
For plotarea I added "adjustLayout":true, and for legend, I added "adjustLayout":false and that worked. Either that or last night's full moon fixed it.
Thanks for the help and tips sdsinc_pmascari

Copy link to clipboard
Copied
Hi Every one I am having problem exporting graphs onto pdf. All graphs are missing when i click the pdf button.i checked my code everything is fine. What i did earlier was increased the time to live of each chart option in CF Admin it worked for almost all the clients but except for one. Are there any SSL Certificates or fire wall settings that is blocking the graphs?
Copy link to clipboard
Copied
It could be a SSL problem. Can you try with non-ssl call?
Regards,
Anit Kumar

Copy link to clipboard
Copied
I'm trying to upgrade from CF8 to 2016. Every single chart in our application looks awful in 2016. It's taken a whole day just to make a few charts look decent but they're still not as nice as CF8 charts. One type that's proving tricky to fix are pie charts. Or pea charts as I call them now because they're so tiny!
I've attached an example. Notice it doesn't fill the plot area. I can't find a way to remove the labels or place them inside or over the slices to allow the pie to become bigger.

Copy link to clipboard
Copied
It's all trial and error using ZingCharts JSON styling. Here's the link to their site:
To get you started here's one of the examples we put together to get some of our pie charts back to "normal".
<cfset plotarea ={
"adjustLayout"=true,
"alpha"=1,
"margin-top"=5,
"margin-right"=5,
"margin-left"=5,
"margin-bottom"=0
}>
<cfset title = {
"visible"=false,
"backgroundColor"="##dcdcdc"
}>
<cfset border = {
"borderColor"="none"
}>
<cfset legend = {
"visible"=false
}>
<cfset plot = {
"highlight"=false,
"value-box"={
"placement"="out",
"connected"=false,
"text"="%t",
"font-color"="##5A5A5A",
"type"="all"
}
}>
<cfchart
databackgroundcolor="##dcdcdc"
backgroundColor="##dcdcdc"
plotarea="#plotarea#"
title="#title#"
border="#border#"
legend="#legend#"
plot="#plot#"
chartwidth="460"
chartheight="260"
show3d="yes"
name="pieChart">

 AdChoices