 Adobe Community
- Home
- ColdFusion
- Discussions
- Re: How to fix chart in ColdFusion 11?
- Re: How to fix chart in ColdFusion 11?
How to fix chart in ColdFusion 11?

Copy link to clipboard
Copied
like many other people who switched from CF9 TO CF11 I'm having issues with the charts too. My chart worked perfectly fine in CF9 and after we did an update to CF11 few things just disappeared or not fit in the chart. In my case I have two elements to fix. One is TITLE, problem is that my title has frame for some reason and if I have more than one row with the text, that can not fit in the title. Second is XAXISTITLE does not show up on the screen at all. Here is my code that I used in CF9 to build my chart:
<cfchart format="#ffPrint#" xaxistitle="#desc#" yaxistitle="#yTitle#" style="ChartStyle.xml" chartheight="700" chartwidth="#graphWidth#" title="#title#" showlegend="#theLegend#" > I played with my code tried to remove some parts to see how that will effect CF11 and I found if I remove STYLE my xaxistitle showed up but still with wrong values. Also I could not find the way how to re size my TITLE box. If anyone can help with this problem please let me know. Thank you.


 8
Replies
8
8
Replies
8

Copy link to clipboard
Copied
I highly recommend you familiarize yourself with ZingCharts and its JSON styling. This is what CFChart uses in CF11. We had to recode all our charts using these attributes.
Adobe doesn't let you know where to find these JSON attributes for some reason but you should find what you need here
Copy link to clipboard
Copied
So in my charts in CF9 I used .xml files to in style="" chart. So now I would have to use .js file to do that? Is that what you are saying? Thanks.
Copy link to clipboard
Copied
No. What I'm saying is you'll need to re-code your styling but it may be best not to use separate files but, rather, JSON strings. There is a lengthy discussion on this topic in another posting and I post a few examples.
Copy link to clipboard
Copied
I used Zinga and that helped to solve some problems. I was wondering if you can help how to push my graph below my title. My title is set to be 200 because I have few lines of text so title expand over my graph now. Do you know how I can fix that problem? Thanks in advance.
Copy link to clipboard
Copied
Can you post the chart styling code you're using as well as an image of the chart you're currently getting?
Copy link to clipboard
Copied
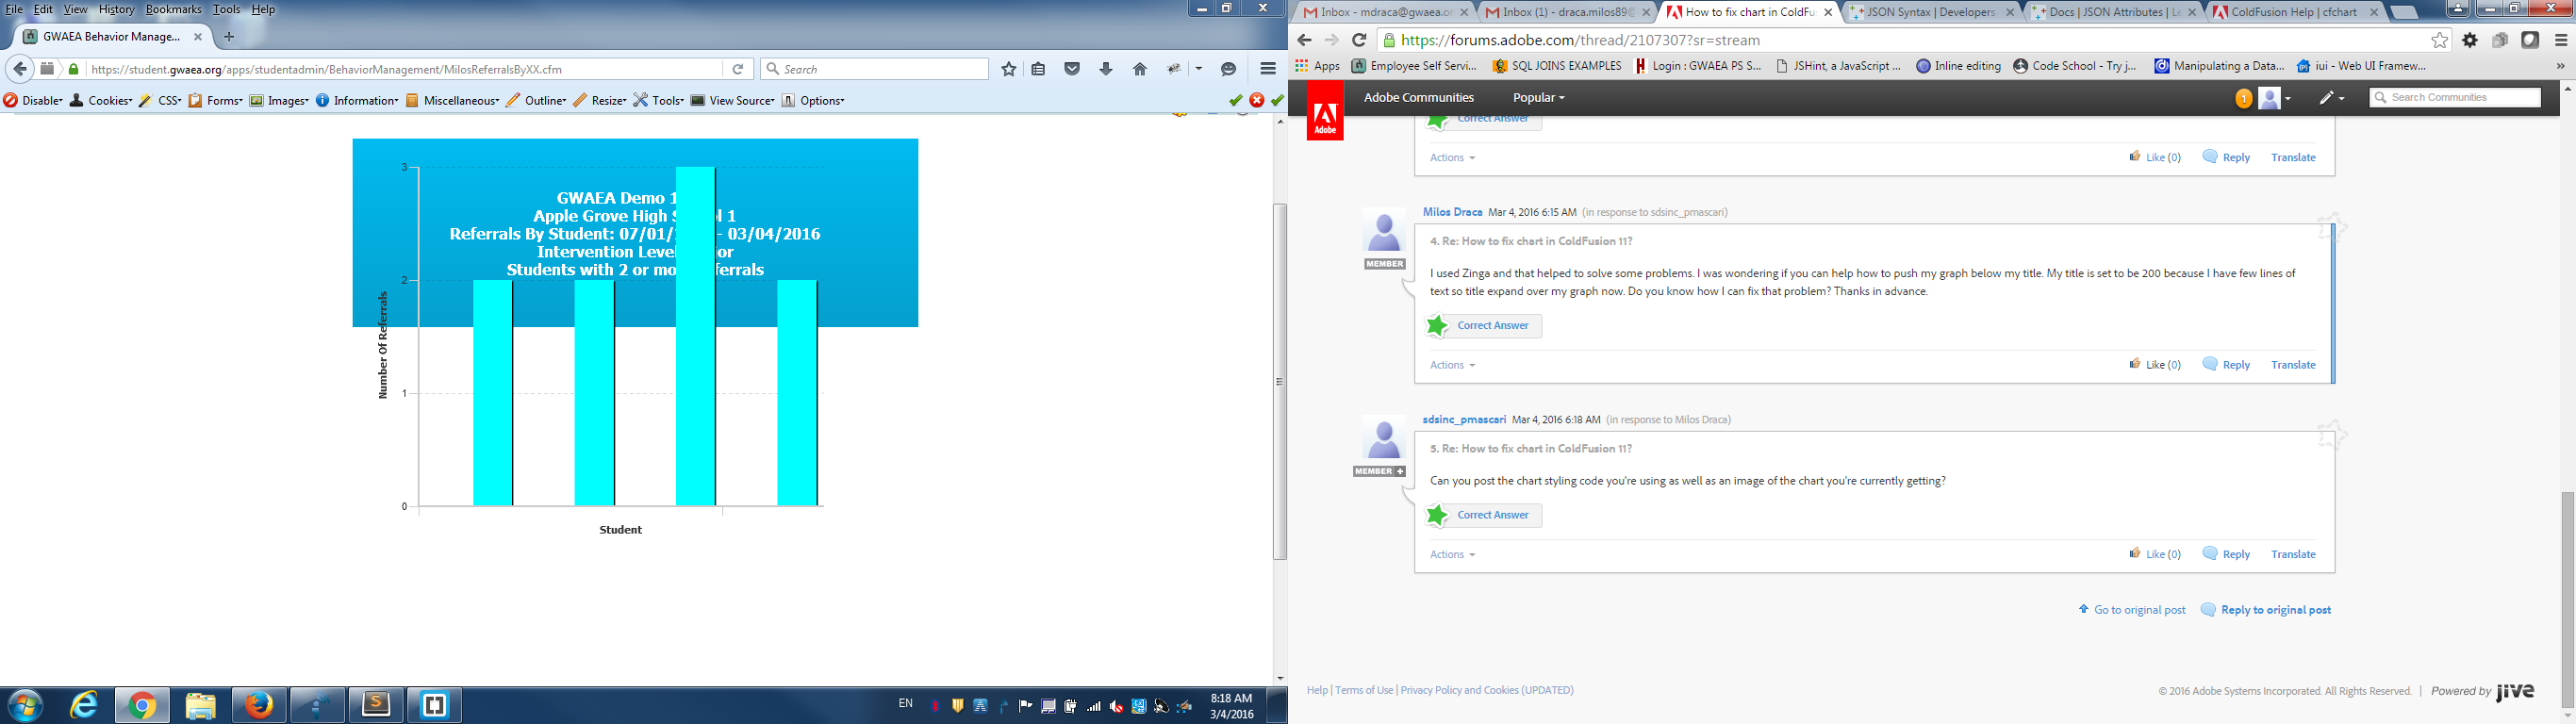
Above is image of my chart, down below is my code:
<cfset title2 = {
"text":"#newT#",
"position":"0% 0%",
"margin-top":10,
"margin-right":0,
"margin-left":0,
"margin-bottom":10,
"height":"200",
fontWeight : "normal",
fontStyle : 'italic'
}>
<cfchart format="#ffPrint#" xaxistitle="#desc#" yaxistitle="#yTitle#" style="test.xml"
chartheight="500" chartwidth="#graphWidth#" title="#title2#" showlegend="#theLegend#" >
<cfchartseries type="bar" itemcolumn="Spacer" valuecolumn="" seriescolor="white" >
<cfoutput>
<cfloop list="#dataList#" index="i">
<cfchartdata item="#i#" value="0">
</cfloop>
</cfoutput>
</cfchartseries>
<cfoutput query="getR" group="theYear">
<cfchartseries type="bar" itemcolumn="#theYear#" valuecolumn="theCount" seriescolor="#listGetAt(theColors,colorIndex)#" >
<cfset colorIndex++>
<cfoutput>
<cfchartdata item="#Description#" value="#theCount#">
</cfoutput>
</cfchartseries>
</cfoutput>
</cfchart>
Also my <cfchartseries> does not show below my graph in between Student xaxistitle and line where value is 0. I had name of each person with an angle. That is second cfchartseries in my code that should give me the names on my graph below. I really appreciate your help. Thank you.
Copy link to clipboard
Copied
In addition to adjusting the title with JSON you're going to need to adjust the plotarea and plot. For instance:
<cfset plotarea ={
"adjustLayout"=true,
"alpha"=1,
"margin-top"=50,
"margin-right"=5,
"margin-left"=5,
"margin-bottom"=0
}>
Will produce margin above your graph for the title to reside.
Again, please look at the examples in the link I posted above. It's a lot of trial and error to get your look back. I know it's a pain in the ass. Thank Adobe. Good luck.
Copy link to clipboard
Copied
How I can use .js instead of .xml file for my style?
Here is my JSON code:
"frameChart": {
"@attributes": {
"is3D": "false"
},
"#text": "",
"frame": {
"@attributes": {
"xDepth": "12",
"yDepth": "11",
"type": "None"
}
},
"xAxis": {
"#text": "",
"labelFormat": {
"@attributes": {
"pattern": "#,##0.###"
}
},
"parseFormat": {
"@attributes": {
"pattern": "#,##0.###"
}
},
"labelStyle": {
"@attributes": {
"isMultilevel": "true",
"orientation": "slanted",
"color": "black"
}
},
"titleStyle": {
"@attributes": {
"font": "Arial-10",
"foreground": "black"
}
}
},
"yAxis": {
"@attributes": {
"scaleMin": "0"
},
"#text": "",
"labelFormat": {
"@attributes": {
"pattern": "#,##0.###"
}
},
"parseFormat": {
"@attributes": {
"pattern": "#,##0.###"
}
}
},
"legend": {
"@attributes": {
"allowSpan": "true",
"equalCols": "false",
"halign": "Right",
"isMultiline": "true"
},
"#text": "",
"decoration": {
"@attributes": {
"style": "None"
}
}
},
"elements": {
"@attributes": {
"drawShadow": "true"
},
"#text": "",
"morph": {
"@attributes": {
"morph": "None"
}
}
},
"table": {
"@attributes": {
"isVisible": "false",
"border": "Financial",
"cellPadding": "1"
},
"#text": "",
"decoration": {
"@attributes": {
"style": "None"
}
},
"colLabels": {
"@attributes": {
"font": "Dialog-10"
}
}
},
"decoration": {
"@attributes": {
"style": "RoundShadow"
}
},
"paint": {
"@attributes": {
"palette": "Pastel",
"isVertical": "true",
"min": "47",
"max": "83"
}
},
"insets": {
"@attributes": {
"right": "5",
"bottom": "5"
}
}
}
I was wondering how I can implement that code in my .js file and use for my style?

 AdChoices