 Adobe Community
- Home
- ColdFusion
- Discussions
- Migrating from CF10 to CF12 - Monitor Your App!
- Migrating from CF10 to CF12 - Monitor Your App!
Migrating from CF10 to CF12 - Monitor Your App!

Copy link to clipboard
Copied
I'm posting this for others that may follow or are having performance issues with CF12, although this probably relates to CF11 too.
I was having issues with my migration from CF10 to CF12, specifically around memory management. This is going from Java 7 to Java 8, so my JVM.config settings didn't carry over and the defaults were negatively affecting my apps performance.
I'm not pushing Fusion-Reactor specifically, I don't get paid by them, but it’s one of the first tools I recommend to those running CF. You really have to monitor your app to know what it’s doing. One of the things I really like about this tool is the section that monitors Memory Spaces. This changes based on the type of GC you’re doing.
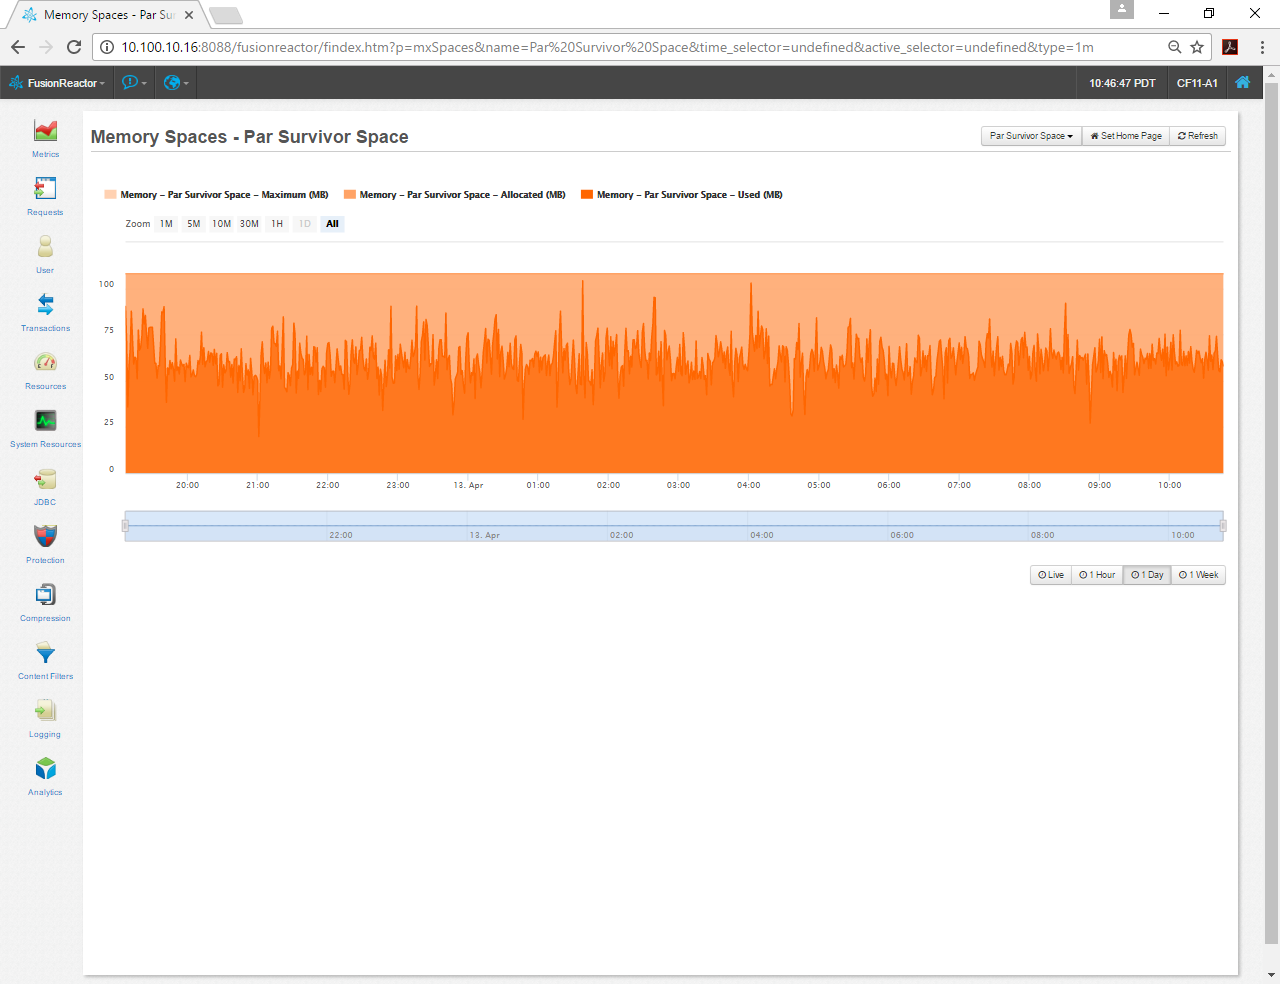
My app performs best with -XX:+UseConcMarkSweepGC -XX:+UseParNewGC , so I have CMS Old Gen, Code Cache, Compressed Class Spaces, Metaspace, Par Eden Space and Par Survivor Space available in the tool. I tried -XX:+UseG1GC, but it was sporadic. I may revisit it later, but it just wasn’t working for me.
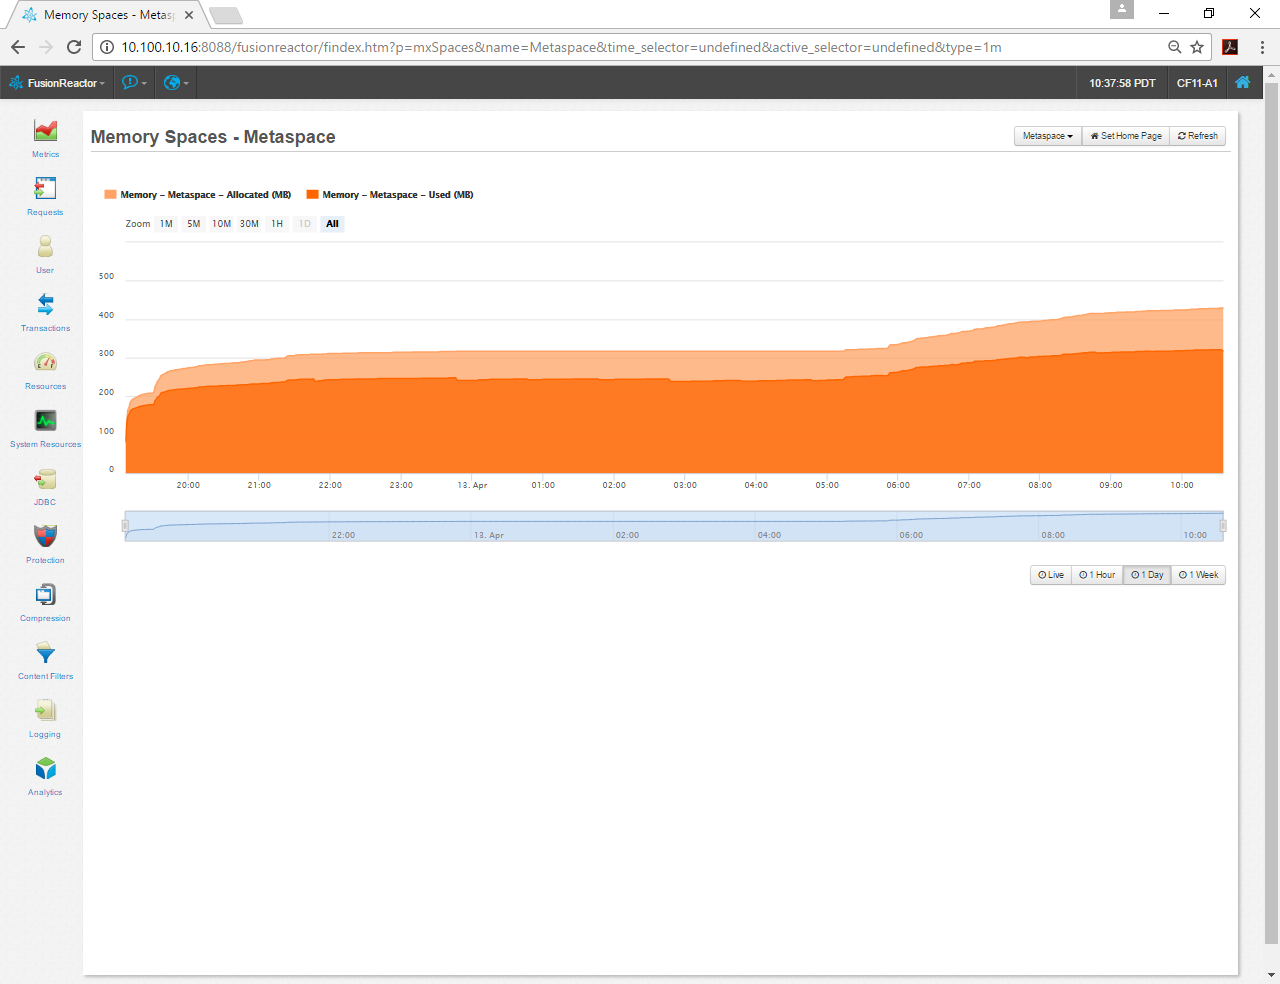
The first obvious thing was the Metaspace, the default size of -XX:MaxMetaspaceSize=192MB was too small. This instance has been running for a day and the charts shows I’m using closer to 320MB. I increased this setting with these two arguments -XX:MetaspaceSize=256m -XX:MaxMetaspaceSize=512m. These are pretty much a replacement for -XX:PermSize -XX:MaxPermSize in Java 7.
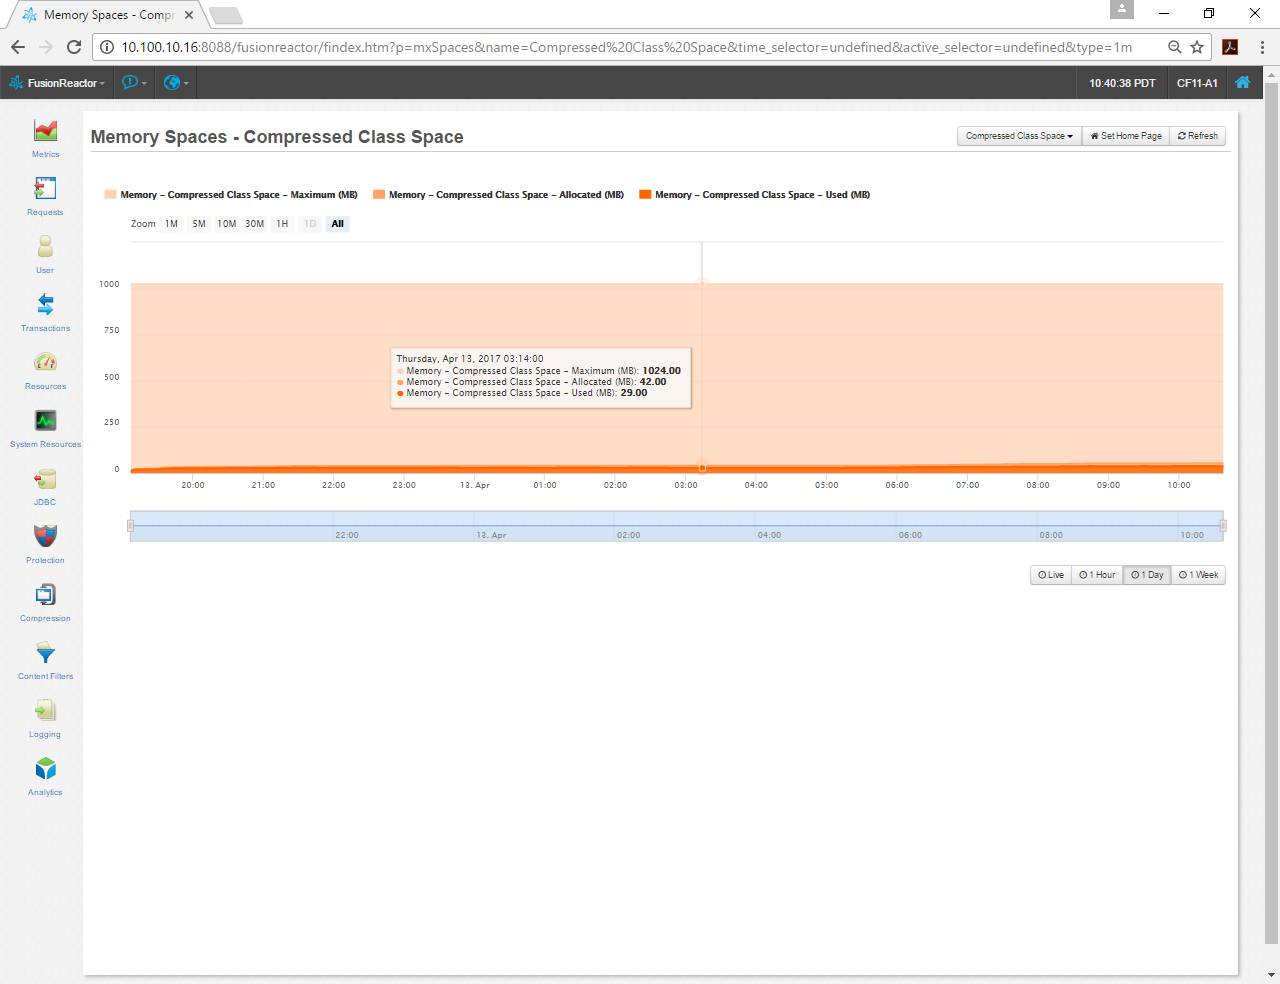
I next noticed that the Compressed Class Space defaults to reserving 1024MB in Java 8. According to my chart, I’m using less than 50MB. This seems like a waste of memory, so I’m going to reduce the default with the -XX:CompressedClassSpaceSize=128m argument.
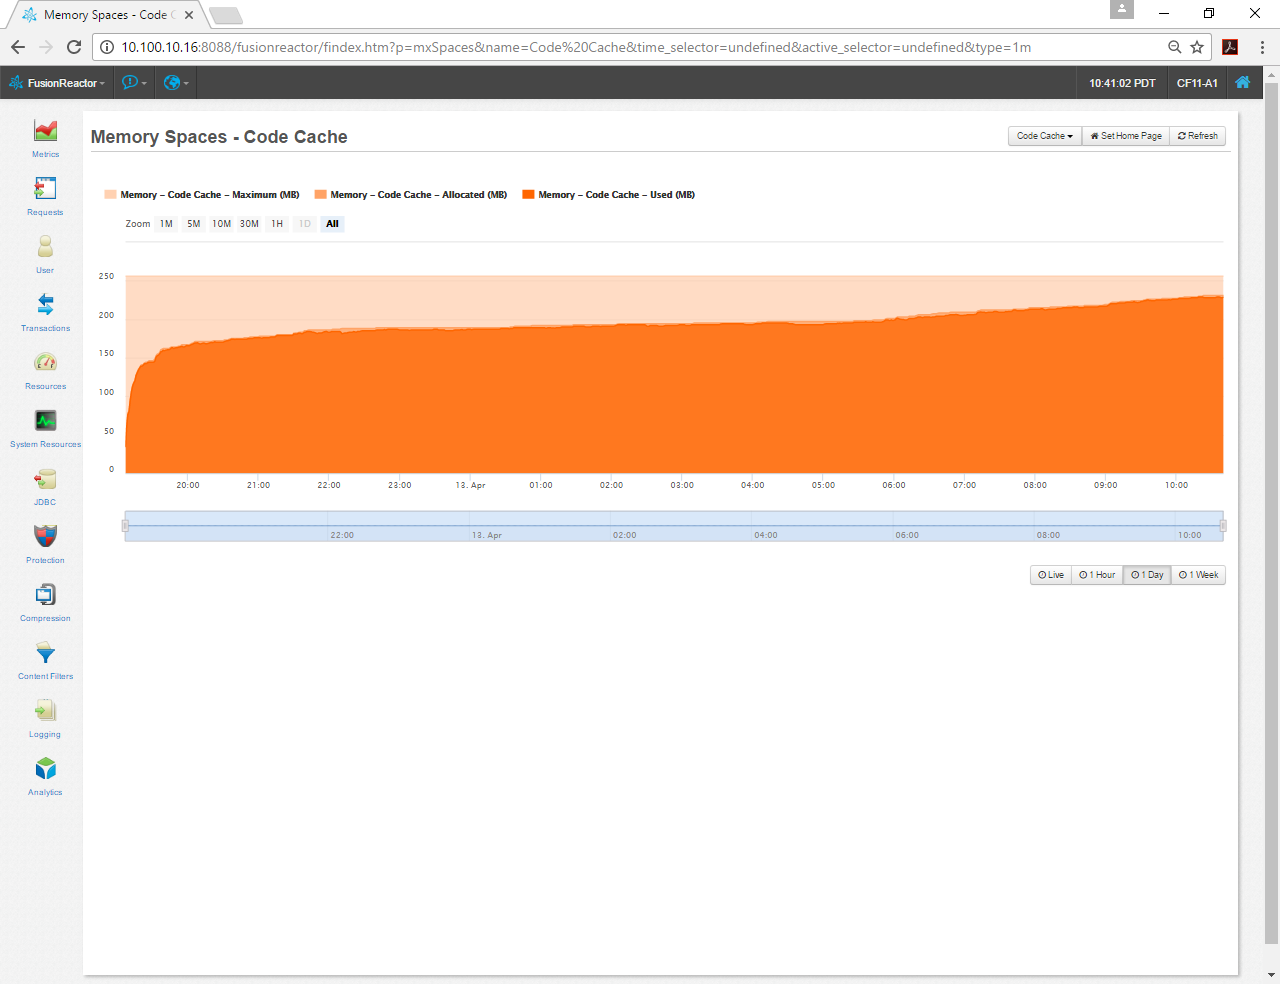
I then noticed that my Code Cache is a little close to maxing out, so I might increase that a little with the -XX:ReservedCodeCacheSize=384m argument.
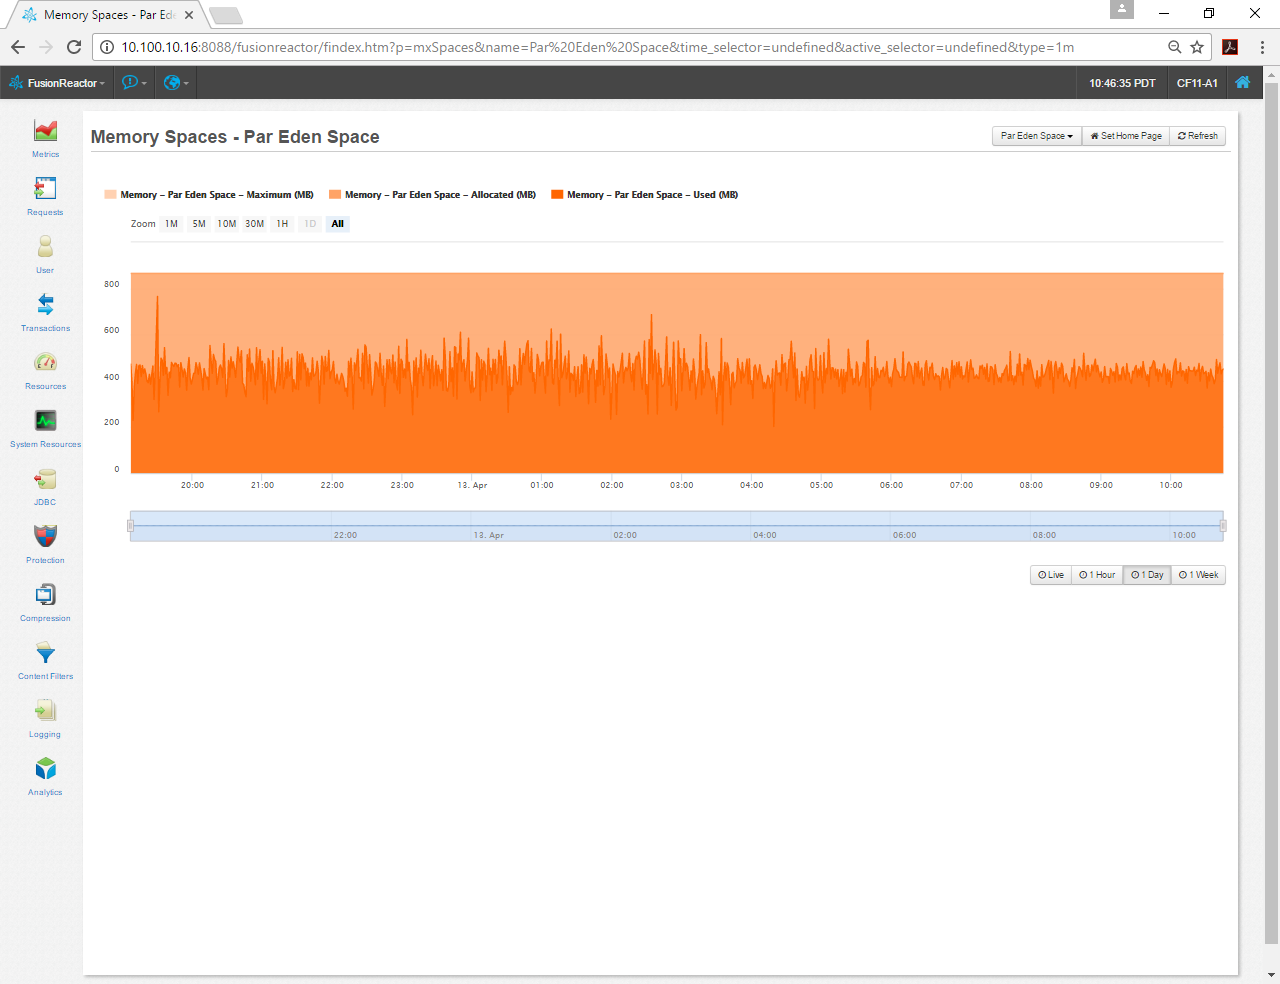
My Par Eden Space looks pretty good, so I’m going to leave that, but if I had issues I might look at these arguments and how they affect my app. -XX:NewSize=1024m -XX:MaxNewSize=2048m -XX:SurvivorRatio=6 -XX:TargetSurvivorRatio=100 -XX:-UseAdaptiveSizePolicy
Par Survivor Space looks pretty good too, so I’ll leave it alone.
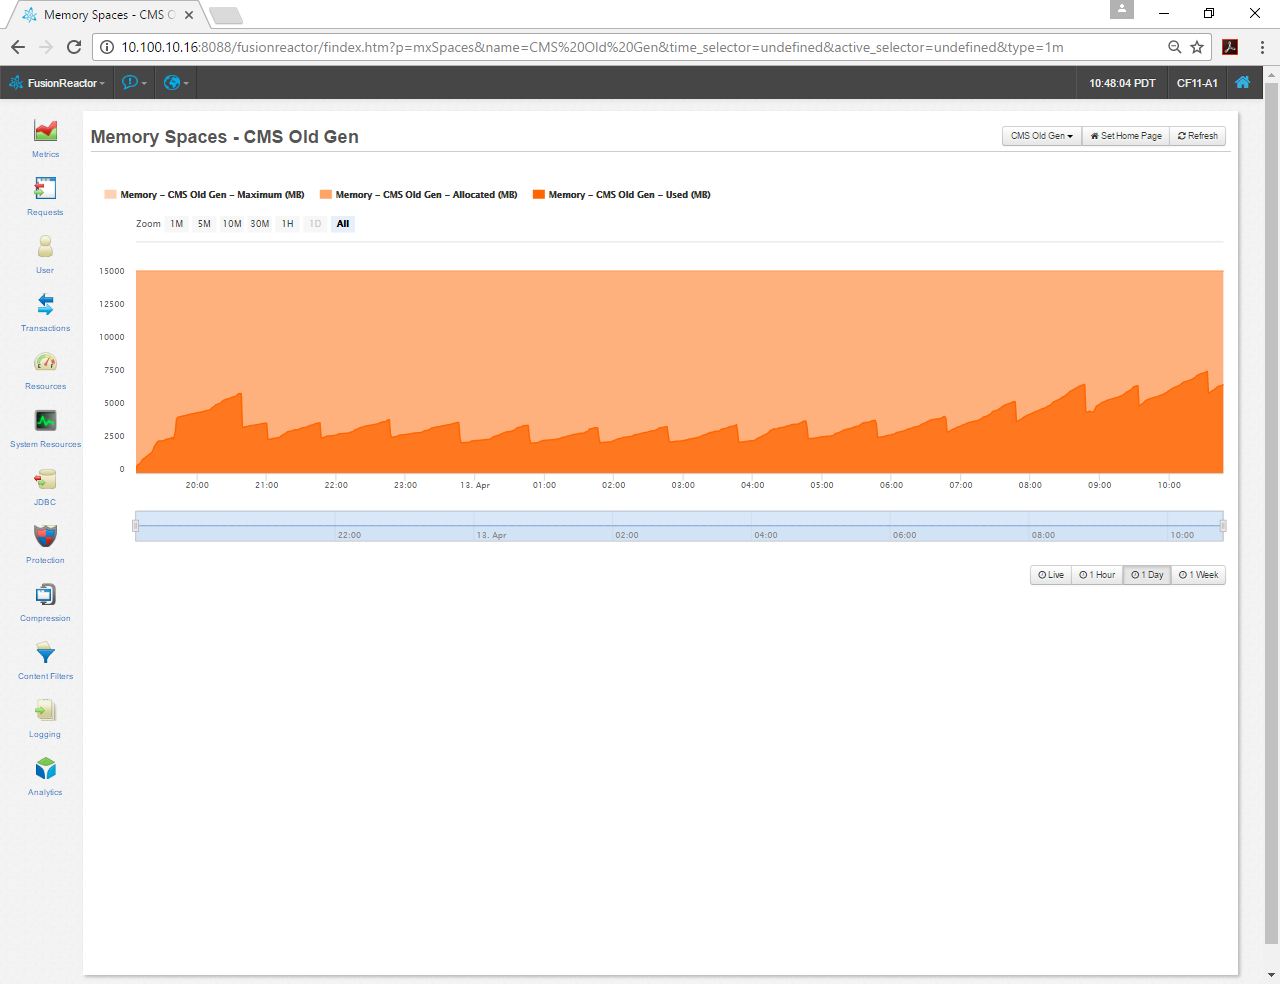
My CMS Old Gen, that’s set with the arguments -Xms16g -Xmx16g, has plenty of space and GC is doing its job. This instance has only been runnign for 24 hours, so I'll give it a few days. I don't want to give it too much space, because that can cause problems of its own. This app gets about 1 million requests a day and can vary on its workload, so I tend to oversize my heap. I may reduce it a little after I’ve monitored to see where it gets maxed out.
I'm going to give some credit to @carl_type3 for this post and re-post his suggestions that I came across while trying to figure out my new JVM settings for CF12. I found his post helpful and I hope you find this one helpful too. Good luck!
Here are some things to consider. CF11 is using Java 8? The RTM installer deployed Java 7 which is Oracle EOL. The refreshed CF11 installer deployed Java 8 (1.8.0_15).
It can be useful sometimes to set minimum and maximum memory the same.
-Xms6144m -Xmx6144m
Java 8 parameter MaxMetaspaceSize=192m is fair to say small so increase that and define an initial setting.
-XX:MetaspaceSize=312m -XX:MaxMetaspaceSize=640m
There are other Java memory spaces in use so you can tune those to match your load better.
-XX:ReservedCodeCacheSize=724m -XX:CompressedClassSpaceSize=296m
What values to use? Do some traditional Java monitoring to a log and read the log or enable JMX and use some JDK tools like jconsole.
-XX:+PrintGCDetails -XX:+PrintGCTimeStamps -XX:+PrintHeapAtGC -verbose:gc -Xloggc:cfGC.log
-Dcom.sun.management.jmxremote.port=8709 -Dcom.sun.management.jmxremote.ssl=false -Dcom.sun.management.jmxremote.authenticate=false
Java manages objects with garbage collectors (GC). You could be experiencing a pause effect from GC routine. So perhaps try a newer or more modern garbage collector. For that you would remove -XX:+UseParallelGC.
-XX:+UseG1GC
Another idea for GC is to change to low pause. Ditto to remove -XX:+UseParallelGC.
-XX:+UseConcMarkSweepGC -XX:+UseParNewGC
Or stick with throughput GC -XX:+UseParallelGC but provide some tuning to it.
-XX:+UseParallelGC -XX:ParallelGCThreads=16 -XX:MinHeapFreeRatio=40 -XX:MaxHeapFreeRatio=70
The aforementioned G1GC and ConcMarkSweepGC also offer tuning settings, so search on those.
Sometimes Java 8 adaptive sizing does not suit the load after many GC cycles so you might like to manage the New part of heap (made up of Eden and 2 survivor spaces) by defining settings. Note not with G1GC.
-XX:NewSize=2048m -XX:MaxNewSize=2048m -XX:SurvivorRatio=6 -XX:TargetSurvivorRatio=100 -XX:-UseAdaptiveSizePolicy
Similarly tomcat offers performance settings by defining pool, thread size settings and timeout.
EG workers.properties
worker.cfusion.connection_pool_size = 400
worker.cfusion.connection_pool_minsize=100
worker.cfusion.connection_pool_timeout = 60
EG server.xml AJP section
maxThreads="400" minSpareThreads="100" connectionTimeout="60000"
HTH, Carl.


 2
Replies
2
2
Replies
2
Copy link to clipboard
Copied
So after running live traffic on CF12 for a few days, I noticed the heap growing more than normal and not going down. I suspected a memory leak, so I went for my next favorite tool. If you want to know what's using all that memory, JProfiler is it. It has some other cool functionality, but I've typically used it for looking into memory issues. You can attach to a running instance, but if you do a heap dump, you'll probably crash it.
This picture doesn't show it, but I had an array that was using 4.6G of memory with 187k instances of it. Once I drilled down to the classes, I noticed a bunch of ZingChart related classes. That's way more than it should have been and certainly using too much memory. This gave me enough insight into why all the memory usage. In the CF Admin, I changed the setting from storing CFCharts in memory to using disk. After I moved my chart caching to disk, the memory usage is now normal.
I haven't submitted a bug related to the leak yet, but if you're having issues with memory and using CFCharts and caching them in memory, you might want to change that until Adobe resolves this issue.

Copy link to clipboard
Copied
When I was looking into this, I realized CF is using Ehcache to cache cfcharts. This is true for both in-memory and disk. They must also be using the timeToLiveSeconds attribute for the expiration and this maps to time-to-live in the CF Admin. I noticed that this attribute was not working for us in CF10 and now CF12. We didn't have a need for it in CF10, so I ignored it. I think this issue might be specific to our setup, I'll need to look into that. So although its a type of memory leak, its just that Ehcache is not expiring the charts in the cache, so they just keep growing. Oddly the time-to-live appears to work when caching to disk.
If anyone else has an issue with timeToLiveSeconds working in Ehcache, let me know and save me some time tracking it down.

 AdChoices