 Adobe Community
- Home
- ColdFusion
- Discussions
- Slow requests build up to database (JDBC request)
- Slow requests build up to database (JDBC request)
Slow requests build up to database (JDBC request)

Copy link to clipboard
Copied
How can I troubleshoot and isolate a gradual build up of JDBC request to our database server (SQL) in CF 11. In the Fusion Reactor, the graph for JDBC starts to climb more and more. Slow web request start to build up also, and then overall web request response times (graph attached).
I am an experienced Sys Admin but with little CF experience. I can provide more info as I'm sure it is pretty general.
I have so far looked at network utilization (no latency) and resources at the OS level (memory, CPU and disk, NIC) are busy, but acceptable on both CF Servers (load balanced) and the database server. (I realize I need to look at the load balancer as well to be sure that is not having issues).
When I restart the CF services, everything is fine for several hours even with a lot of connections/activity 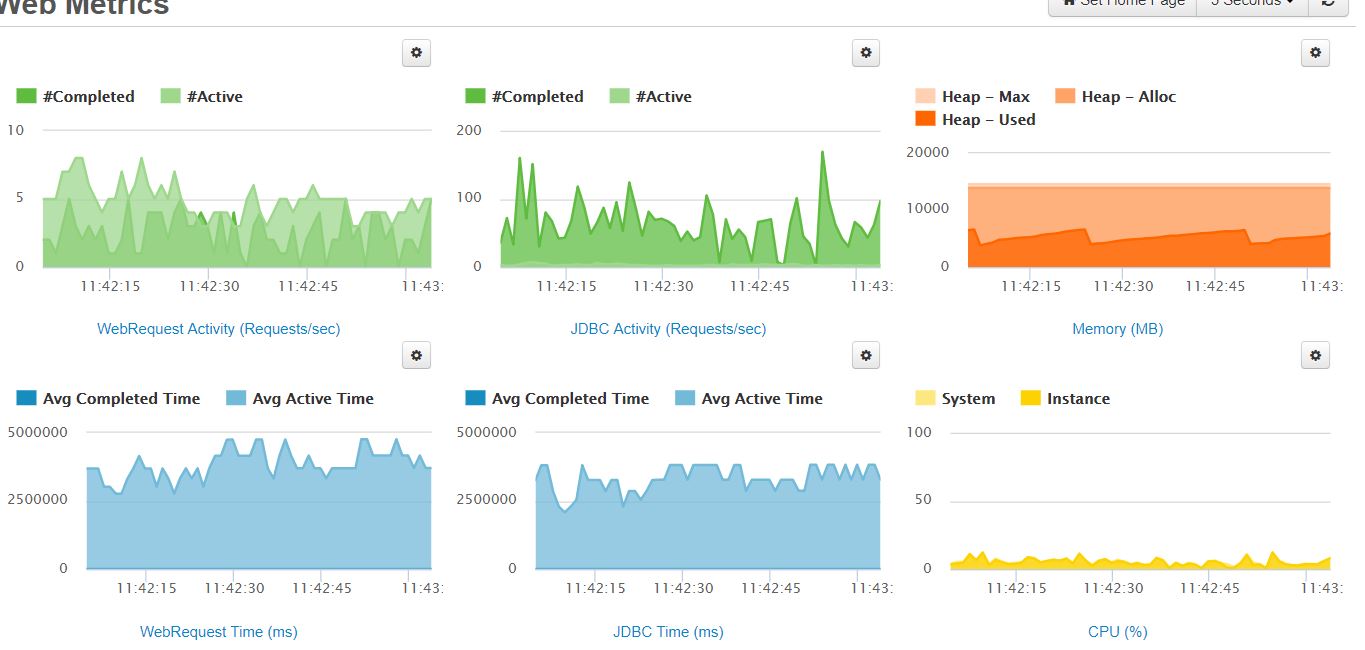 immediately resuming.
Is there anything I can do at the Cold Fusion level? To me, since physical network and server resources appear normal, it seems like it may be in the code, however I'm not sure how to distinguish this.
Thanks in advance,
Steve


 6
Replies
6
6
Replies
6

Copy link to clipboard
Copied
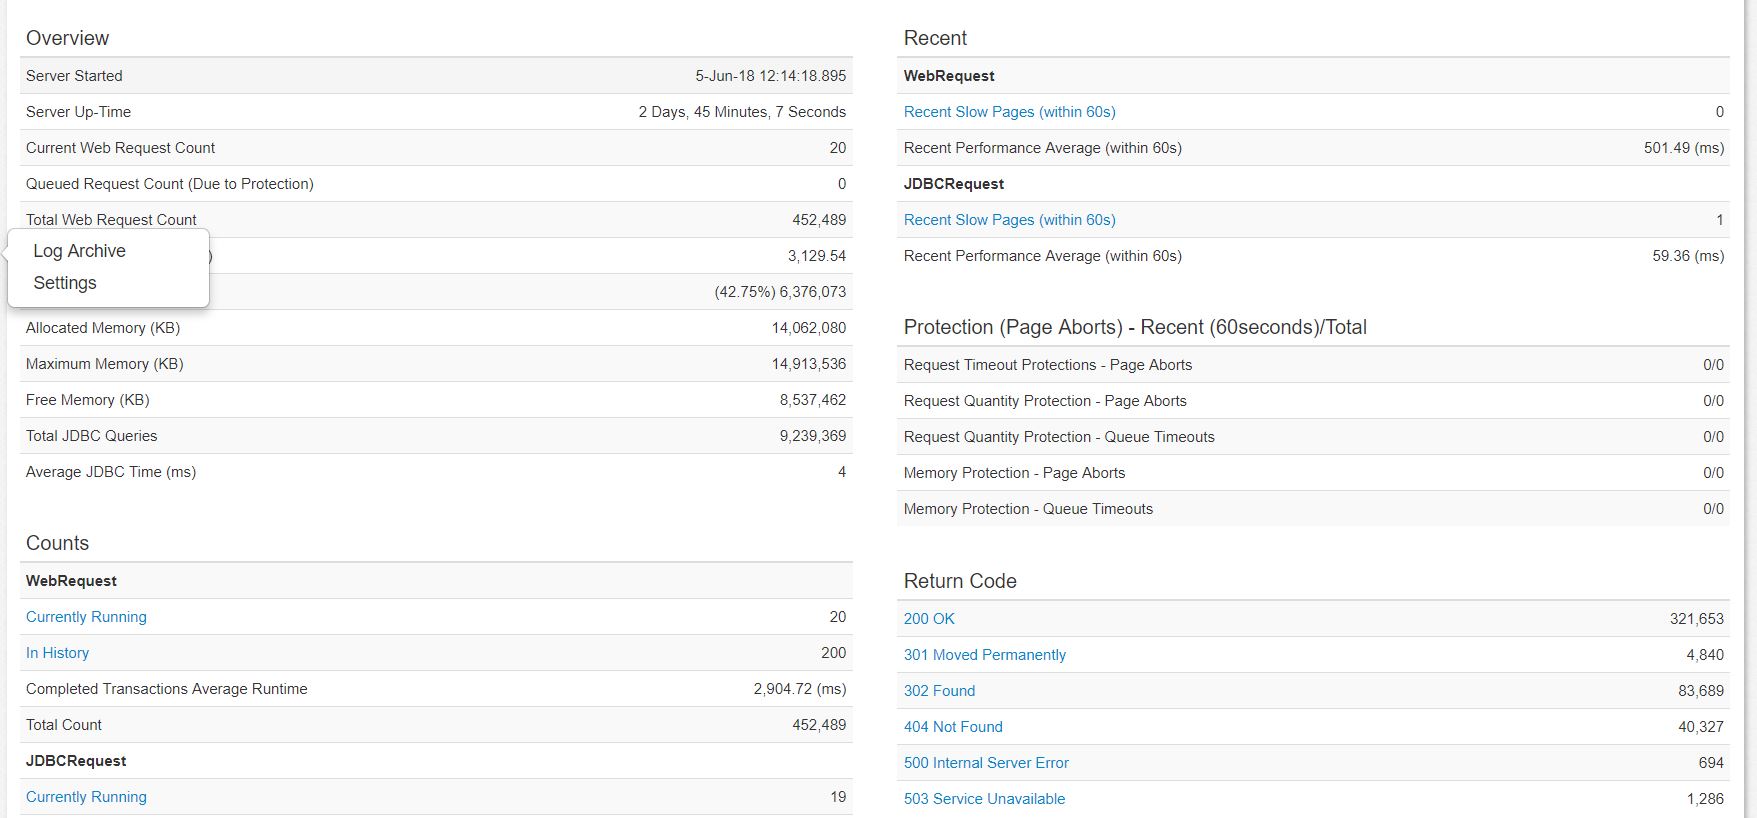
Steve, that screen does not show a build up of queries over time. The top middle graph has a light-green value at the bottom of the dark green, which would reflect the number of queries. It looks to be single digits in number. If you looked at and/or had shared with us the text below the graphs, that would have told you how many queries were running.
Same with number of requests (in both regards): the top left graph shows at most 8 requests “running” (the light green in the top left graph). The dark green, which is your requests per second (or what they label “#completed”) is averaging about 3, throughout this minute on the screen. And while the bottom two graphs show that those requests and queries that ARE running are very slow, I just want you to realize that this is not reflecting a build up of overall poor response time. (Just because a few requests are running slow does not mean all are. And the bottom left graph’s dark blue value--showing the avg response time of those completed requests--seems very small, but you’d have to have moused over it and captured that for us to know.)
So that should at least diminish the concern that there is some grave problem affecting all requests.
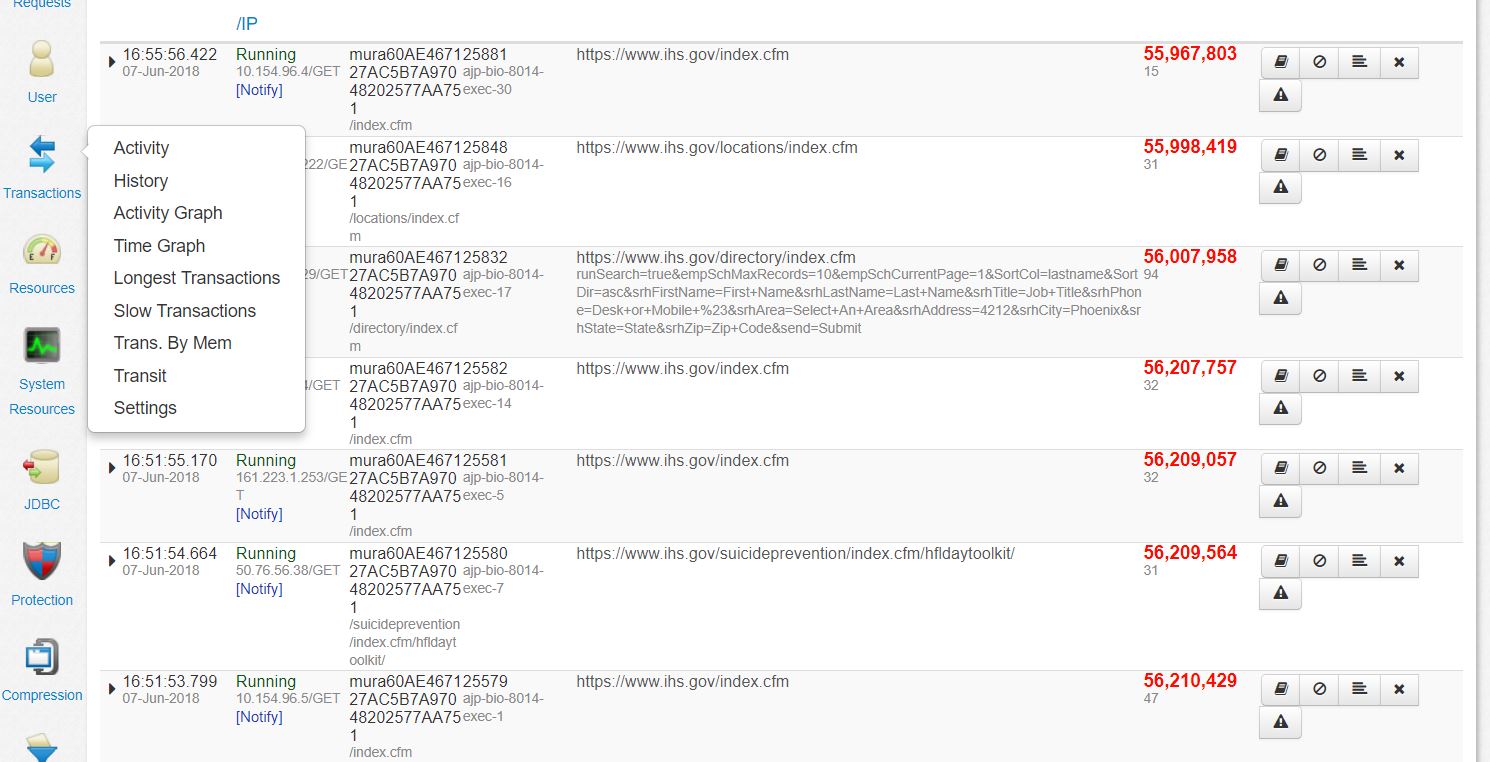
But you are understandably still left wondering: what requests are running slow, and what queries, and why? And the answer to the first is under requests>activity (in FR). That will show what requests ARE running, and you would see in this case the few/several that were running slow. (But the requests>history would show that many requests (the few per second) were running fine.) And clicking on the slow requests to see their details, you'd see an available "jdbc" tab that would then show the top 30 slowest queries in that request, as well as any running one. And that would show you WHICH queries it's hung up on.
So about those stuck running long-running queries, you may still wonder: "ok, why are they stuck?" And that’s where you’d want to check your DB and see if it shows any long-running queries. You may say you did do that, but you don’t say that above. Now, sometimes one will look at the DB in such a case and depending on the tool used, it may say there are none running slow—even though there are. See a blog post I did about this, with regard to SQL Server specifically:
http://www.carehart.org/blog/client/index.cfm/2015/2/10/show_running_sql_server_queries
I will assume you do mean you are using SQL Server (you said, just “our database server (SQL)”), so if the CF requests might still be running now (as you read this), see what that query I offer does say. If it says there are indeed NONE running (though FR still says CF thinks they are), then the question becomes “why is CF still waiting?”, and solving that is a whole other problem.
But again, the good news is that since other requests are running, your CF is “dead in the water” (or even “dying”. As you may know, the CF Admin has a “Request tuning” page with “max simult requests” which may be 20 or 50 or more. And if CF was a highway, you have broken down cars in a few lanes, but plenty more lanes to let other traffic through.)
And if it weren't that FR clearly shows us that it says CF thinks the requests are waiting for a query, you could use FR's (and Java's) "stack trace" feature to find out what those requests were doing. But in your case, again, FR says that CF thinks these requests ARE running slow queries (because of the light values in the middle graphs). FWIW, I do have blogs and resources on stack tracing requests.
And indeed I have entire webinars at the FR site (fusion-reactor.com/webinars), including the most recent that was specifically on troubleshooting query performance issues with FR. If you have time, you may want to check those out. But I hope that what I've shared will help you see things a bit differently. And if you want to dig further but are pressed for time, and want direct help, I can offer it via consulting as discussed at the consulting page at carehart.org. There could be other matters affecting you, and far too many to consider and explain here in the forum.
But I suspect you will find that in this case, the easiest thing will be to just schedule CF to be restarted some evening, because it’s not likely that this is “killing you” and you can wait to then. If it happens again, and you want to dig into it, that would be something to then later reconsider. (I agree that "just restarting CF" is not an optimal solution, but in a case like this, it may again simply be the "easiest" thing to do, since the CF instance is not really "crippled". More like it just has a hangover and needs to... um, you know, purge the demon. 🙂
Hope that’s helpful. If you want to offer more info and try to discuss more here (with me and others, and for others), we can. I just fear that it may be tough to really “solve” this for you this way.
/charlie
/Charlie (troubleshooter, carehart.org)
Copy link to clipboard
Copied
Hi Charlie --- thanks so much for all of this useful information. I will use the blog to research further as well as FR components that you mentioned. I restarted the CF service about 2 hours ago (and then took a very long lunch!) and everything is running very well now. If it builds up again (unfortunately, I'm pretty sure it will in the next day or so) I will post the other numbers you mentioned. I do know what you mean about the time window for the graphs. I'm going to research the blogs for a bit, especially on the queries --- it is SQL Server, and hopefully will be able to narrow it down more and post more detailed info. Thanks again! Steve
Copy link to clipboard
Copied
Cool. 
/charlie
/Charlie (troubleshooter, carehart.org)
Copy link to clipboard
Copied
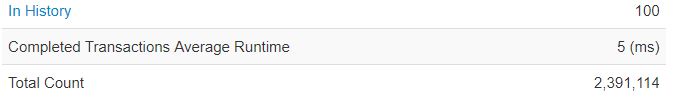
The graphs are climbing again, soon they will be pegged. I have captured the bottom numbers again to see if the reveal anything further, (and I still have stuff to learn/track down after Charlie's detailed post, just seeing if this helps more). Ping's to the database server reveal no problem with network latency (from CF Servers to the SQL Server database). Any suggestions/help are greatly appreciated. Steve
Copy link to clipboard
Copied
It looks like one application running on CF is the main culprit = Here are requests that CF is "waiting" for, but the database has probably responded. Is there a way to kill these process after a certain amount of time?

Copy link to clipboard
Copied
Hi Steve,
I would like to know whether you have found the solution for your issue above.
I'm thinking our server also act like what you have described above.
I'm still looking who/what is the culprit for this issue.
If you can share what you have done, it would be helpful. Thank you.
Kind Regards,
Raquel Septiane

 AdChoices