Copy link to clipboard
Copied
Hi,
I am trying to debug my panel creation.
I have .debug file properly configured in my panel root and i can access it via Chrome.
I can see the log files as well.
I use Visual code extension for extended script to debug script i create for Photoshop.
Is there a way to interactively debug my panel code, similar the the was I run a debugger to analyze my scripts in visual code?
Dan
 1 Correct answer
Have you tried setting breakpoints in Chrome Dev Tools under the "Sources" tab?

You can set up VS Code to debug CEP panels, but I prefer to debug CEP in Chrome Dev Tools and ExtendScript in VS Code with the new extension.
Copy link to clipboard
Copied
Have you tried setting breakpoints in Chrome Dev Tools under the "Sources" tab?

You can set up VS Code to debug CEP panels, but I prefer to debug CEP in Chrome Dev Tools and ExtendScript in VS Code with the new extension.
Copy link to clipboard
Copied
Thanks
I set BP as you suggested.
As for visual code, you refer to the extended script extension, correct.
If yes then i use it to debug the actual code which, in my case, Photoshop run.
Can you also debug with it the jsx files in the CEP panel?
Copy link to clipboard
Copied
Yes,
CEP Extension / ES6 == Debugging in Chrome Dev Tools.
ExtendScript / ES3 == Debugging in VS Code with Adobe's ExtendScript debugger extension.
You can run these both at the same time if you like.
Copy link to clipboard
Copied
Yes this is what i use, apart from running them both at the same time.
How can you debug, in VC, jsx whiuch was triggered by the panel?
Dan
Copy link to clipboard
Copied
What's worked for me is launching the app with the extension, open the extension, then start the Debug Session in VS Code and say set a breakpoint in one of the functions. This will overwrite my existing objects/functions called by my panel with the new objects/functions from the VS Code debugger. So now if I click a button on my CEP panel that triggers a function in ExtendScript, it will stop at that breakpoint.
Copy link to clipboard
Copied
Thanks,
I must be doing something wrong...
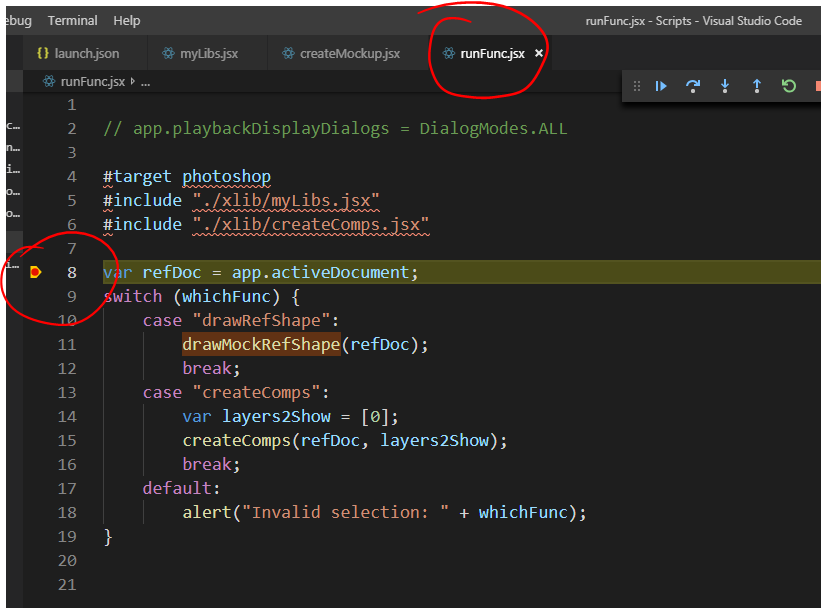
My panel is meant to run "runFunc.jsx"
1. I open the panel
2. I start my debugger in VS code by running a script which calls "runFunc.jsx" ans a set a BP there.
(I think this is the part I am doing wrong though...)

3. i run the panel action which is supposed to call "runFanc.jsx".
VC does not take over in my case and "runFanc.jsx" just runs as expected from the panel.
Copy link to clipboard
Copied
Your code is just in the global scope so it's not going to be called from a panel this way, it's just going to run once and then be done. If you put it in a function, then call that function from your extension, then it will run and hit the breakpoint from the CEP panel.
