- Home
- Exchange
- Discussions
- Re: ExtendScript VSCode Debugger 2.0.2 Live in the...
- Re: ExtendScript VSCode Debugger 2.0.2 Live in the...
ExtendScript VSCode Debugger 2.0.2 Live in the VSCode Marketplace 🎉🎉
Copy link to clipboard
Copied
Version 2.0.2 of the ExtendScript Debugger plugin for Visual Studio Code is now available in the Visual Studio Marketplace! Thanks for waiting for this massive rewrite of the 1.0 Debugger, with huge improvements to host app connectivity, flexibility, speed, and best of all, the elimination of Error #15.
Our proudest accomplishments:
- Run a script without debugger involvement.
- Debug multiple hosts simultaneously.
- Debug with different VS Code windows simultaneously (not the same host app, of course).
- Run compound debug configurations (useful especially for CEP workflows).
Known issues: M1 Mac users will need to launch Visual Studio Code in Rosetta mode to see the update. Currently the Debugger is not supported on Windows ARM devices.
Thank you to everyone in the prerelease community who helped test this!
Copy link to clipboard
Copied
Thank you for the update.
I am still new to programming and especially VSCode and do not know how to reconfigure my launch.json to gain functionality I had in v1.1.2. I've read the "Details" section most of which is still over my head. I realize all of this is elementary to a true programmer, but I (and I am guessing others in this forum) are illustrators turned scripters and it can be daunting, intimidating and descouraging at time.
Can someone show how this launch.json should be changed to function in v2.0 as it did in v1.1.2? I was able to get v2 to run a script in Illustrator but it does not stop at a set breakpoint now.
{
    "version": "0.2.0",
    "configurations": [

        {
            "type": "extendscript-debug",
            "request": "launch",
            "name": "Illustrator",
            "dontBreakOnErrors": true,
            "program": "${file}",
            // "targetSpecifier": "illustrator-24.064",
            "targetSpecifier": "illustrator-26.064",
            "stopOnEntry": false
        },
    ]
}
Copy link to clipboard
Copied
The new version's documentation has a section on migrating from V1 versions. In short, your launch configuration should look like this:
{
    "version": "0.2.0",
    "configurations": [
        {
            "type": "extendscript-debug",
            "request": "launch",
            "name": "Launch in Illustrator",
            // "hostAppSpecifier": "illustrator-24.064",
            "hostAppSpecifier": "illustrator-26.064",
        },
    ]
}
You will note that I took out the "program" field. That has been renamed to "script" in V2. Regardless, I removed it because the setting "${file}" is the default functionality (it sends whatever file is focused in VS Code to the host for evaluation).
I also renamed the configuration to "Launch in Illustrator" to disambiguate what it's doing (the new version supports attaching as well as launching).
That should be it. You should be able to click the "Start Debugging" play button in the Run and Debug View and have VS Code connect to your host application and run the script you have focused. Breakpoints in the focused script should be triggered and cause the beak UI to show.
Copy link to clipboard
Copied
Thanks. I had tried those settings and when I click "Start Debugging" it does not stop on a breakpoint. I am still missing something.
Copy link to clipboard
Copied
Can you share the script you are attempting to check? Or a portion of the script? Or create a simple script that you don't mind sharing?
Copy link to clipboard
Copied
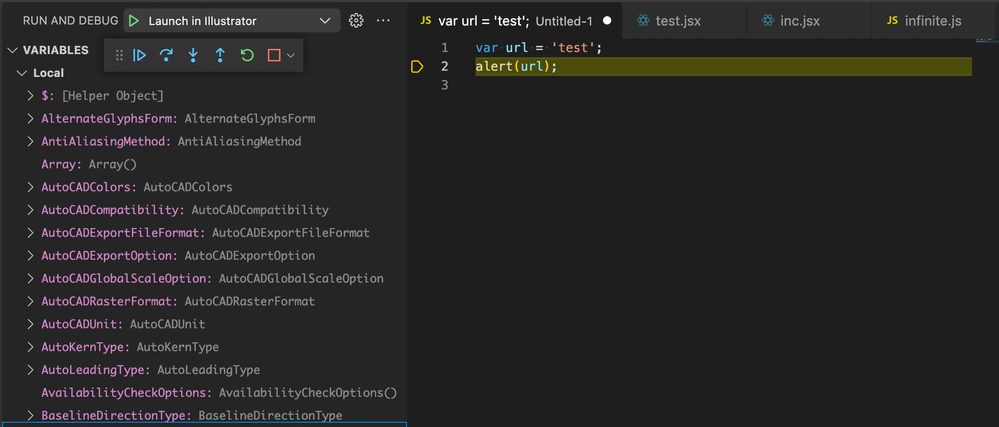
It doesn't matter what the script is. This one will do:
This is the launch.json
When I type F5 or Menu: Run: Start Debugging the script runs but does not stop on the breakpoint on line 2.
I am used to seeing this floating panel fully active. Now the "Step" options are grayed out:

Copy link to clipboard
Copied
Hmmm... The mostly grayed out debug controls you showed in the screenshot indicates that the script is running but not stopped at a breakpoint. I just tested in Illustrator 2022 using the very same configuration you just posted and got this:
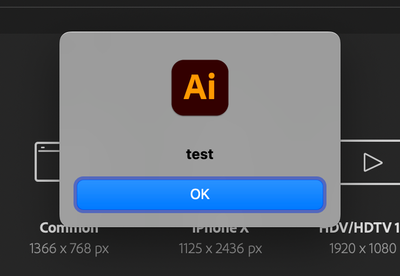
To confirm, you are at least seeing the alert appear, yes?
Copy link to clipboard
Copied
Yes the alert works. I can run a script. The debugger just doesn't engage. I also see this error message after running a script in the new configuration:
UPDATE:
I restarted Illustrator and the debugger started working! Thanks for your help, @sberic .
Copy link to clipboard
Copied
Ahh, right! That can happen if the application had ever had contact with either the original ESTK or the V1 extension without getting restarted. Those two debuggers register with host applications in such a manner as to make them the exclusive debugger applications until the host application is restarted. This does not happen with V2.
There is a note about this issue in the General Notes:
- If the ExtendScript Toolkit (ESTK) connects to a host application, then the ExtendScript Debugger extension will no longer be able to function correctly as a debugger. Restarting the host application is enough to fix this issue.
Hopefully your discovery and this explanation may help others who encounter a similar issue!
Regardless of the details, I'm glad you were able to get it working!
Find more inspiration, events, and resources on the new Adobe Community
Explore Now


