

- Home
- Flex (read-only)
- Discussions
- Re: Flash Builder 4 - Debugger fails to connect
- Re: Flash Builder 4 - Debugger fails to connect
Flash Builder 4 - Debugger fails to connect

Copy link to clipboard
Copied
I've looked at the various other threads but no luck so far.
I'm using Flash Builder 4 and the Flex API 4 and until yesterday all was well - i.e. I could run my app in debug mode. Somehow today things stopped working. Not sure why - I didn't tweak anything in Flash Builder's options. When launching any app (most complicated to the simplest) I get a status bar telling me
launching: waiting for Adobe Flash Player to connect to debugger
that always gets stuck at 57%. Then after a few minutes I get
Failed to connect; session timed out.
Ensure that:
1. You compiled your Flash application with debugging on.
2. You are running the debugger version of Flash Player.
I'm using Chrome on Windows 7. I really need to debug.
thank you for any help.


 45
Replies
45
45
Replies
45

Copy link to clipboard
Copied
Hi It's me again. I am trying to debug my application but somehow it pop me this error,
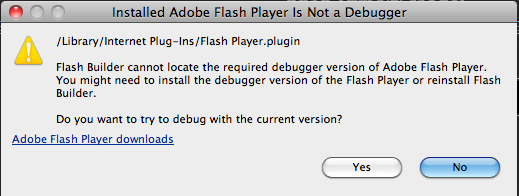
I downloaded and tried to install Adobe Flash player, but then when i tried i still have this error. I check the path and found out that the Flash Player.plugin is in the correct directory. Below is the directory captured image.

Appreciate your help on this.
Thanks

Copy link to clipboard
Copied
Just an FYI, for anyone encountering the issue where the debugged sporadically connects to the browser debugger... Download the flash projector (stand alone) debugger. Edit the projects debug settings and in the url to debug change the .html to .swf. Instead of luanching in a browser it will launch in the stand alone flash projected application and connect every time. Happy Coding. For even more awesomeness use HellFire Daemon Compiler... its freaking insane!
Copy link to clipboard
Copied
Hey Geek,
Thanks for the advice... my bad.. i just noticed that my FP is without a dubugger plugin.. stupid of me. LOL.. i managed to download the plugin with debugger and it works ok... Im still new and trying to learn programming.
Thanks Again.. =D

Copy link to clipboard
Copied
I am having the same issue however it's an AIR app so it is already a stand alone. Any ideas on this?
Copy link to clipboard
Copied
make sure you install the flash projector debug version -
http://download.macromedia.com/pub/flashplayer/updaters/10/flashplayer_10_sa_debug.exefor
windows, for mac -
http://download.macromedia.com/pub/flashplayer/updaters/10/flashplayer_10_plugin_debug_ub.dmg
... that should work...
Copy link to clipboard
Copied
Hi all,
I ran into the same issue today and found this page while searching for help.
None of the suggestions helped. But there was a suggestion to debug in flash itself. So I opened the .html file from bin-debug in the flash builder itself - basically double click, and it worked in the builder. Now the surprising part is I had not closed the applications I'd started for debug, these were still stuck at 57%. These started opening in my browser with debugger version of flash player!! And it was debugging fine!
Guess the trick is to click on the .html file while the progress bar is stuck at 57% for debugging the application. No clue why this works.. I have tried this 2-3 times and it worked always.
hope this helps someone.

Copy link to clipboard
Copied
This happens because the Flash Debugger uses sockets and it failing to connect to the flash content in the browser.
I find this happens to me when I accidently delete my debug configuration when I delete the project and recreate it.
Developers tend to forget thta if you delete the project and recreate it it will delete your debug configuration as well.
In my Debugging configuration, the default is to debug it from a html file from your file system, but in almost every case
you want to specify a URL because you want to debug how your flash app will act after being actived from a web server.
If it stuck at 57% just terminate it because it will not connect and check you debig configuration setting

Copy link to clipboard
Copied
I'm having this exact issue with Flash Builder 4.5.1, flex sdk 4.5.1 and air 2.7
My apps are air apps, they run fine, but can't debug. For a mobile application, i can debug on the mobile device, but not on desktop (emulator).
The error is always debugger can't connect to the application.
This is the error when i kill the app before Flash Builder times out trying to connect, it halts at 57%:
Process terminated without establishing connection to debugger.
Launch command details: "I:\Adobe\Adobe Flash Builder 4.5\sdks\4.5.1\bin\adl.exe" -runtime "I:\Adobe\Adobe Flash Builder 4.5\sdks\4.5.1\runtimes\air\win" -profile mobileDevice -screensize 480x762:480x800 -XscreenDPI 252 -XversionPlatform AND "C:\Users\mia\Adobe Flash Builder 4.5.1\test\bin-debug\test-app.xml" "C:\Users\mia\Adobe Flash Builder 4.5.1\test\bin-debug"
This is the error if i let the process to time out:
The Flash Builder debugger failed to connect to the running application.
Ensure that:
1. For in-browser applications, you are running the debugger version of Flash Player.
2. For network debugging on a mobile device, you have a reliable network connection to the device, and port 7935 is open on your machine's firewall.
Device connection help
Flash Player is really got nothing to do here since i'm trying to debug Air apps.
Debugging worked fine with Flex sdk 4.5 and air sdk 2.6.
After updating to air 2.7 and sdk 4.5.1 i couldn't debug any Air app, mobile or not (although i can debug on the mobile device, however it's a pain to always debug on the device, it's just a waste of time)
I'm using windows 7 64b btw
Is there any solution for this?
Thanks
Copy link to clipboard
Copied
I have encountered this situation many times in Flash Builder 4.5 and it always seems to occur when, prior to launching the application from the Builder I was using phpadmin (wampserver) and failed to close this application in the browser before staerting the debugger.
The app load hangs at 57% every time.
Copy link to clipboard
Copied
I don't have wampserver installed nor am I using phpmyadmin on this computer.

Copy link to clipboard
Copied
flex 4.5
Window xp sp3
wampThis worked for me.debug your application en FLEX, when the message appears (bla bla bla 57%), go to your browser.Right click on the application (in you browser), you will see a menu.Select Debugger (you must have installed the flash player debug)In the new window, select "localhost" and Click on the button "connect"And that's all.I hope this helps.

Copy link to clipboard
Copied
I'm having the exact same problem that pin05h is having - debugging in AIR, Flash Builder hangs at 57%, get the same error message every time, not running phpadmin or wampserver. However, when I debug the application, not only do I have nowhere to right click and say Connect (the window does not appear until the error does), but the error only lasts 3 or 4 seconds.
How do I specify that I want the app to run in the browser? And, if we are using AIR-only features (which I'm not sure I am), how do we fix the debugging issue there? Thanks for working to fix this issue.
Copy link to clipboard
Copied
If you have many browsers installed in you pc, you can choice one of them doing this:
FLEX:
Window->Preferences
General->WebBrowser;
Then, you can select the browser where you have installed the debug plugin.
Now, in the code: Right click->Debug as Web Appication.
Message was edited by: A_O_9

Copy link to clipboard
Copied
hi i have the same problem, adobe flash builder keep proceeding on 57%, i tried the solution of disabling chrome plug in but nothing happens, please help

Copy link to clipboard
Copied
Are you sure you don't have a JS error in your HTML wrapper?

Copy link to clipboard
Copied
Steps to resolve this issue, on window machine
- Go to control panel -> add and remove programs
- Uninstall Flash player 64 Bit and Flash Player 64 Bit Active X Player
- Re-install Flash Player 32-Bit version Debugger player.
- Exit your browers if required and Restart you IDE.
This solved my problem, i hope it solves your problem with the warning message on debug click in the IDE. 

Copy link to clipboard
Copied
If you are using Chrome and the Flash plugin, be sure to disable the build in Flash plugin in Chrome:
- Type in you addressbar about:plugins.
- Click on details (in the upper right corner).
- Scroll to the flash plugin. Here you see two files (if you installed a debug version yourself).
- Disable the build in Flash plugin (which is located inside the chrome install folder).
- Restart Chrome, and start debugging your flash content.

Copy link to clipboard
Copied
I have the same issue on FB 4.6 when connecting to IE 9.0.8... for a debugging session. Can't get past 57%
Funny thing is - the environment WORKS FINE for many sessions - and then just stops working after a while.
Cleaning the project, restarting FB, killing tasks... all do nothing.
I can't right-click on the application to get the player's context menu (as suggested above), because the app is not yet running! IE just dings the system bell when I try that.
Copy link to clipboard
Copied
The workaround I've discovered - which works specifically for the situation described above - is to...
Keep an eye on the FB launch progress indicator as you start your debug session, after the blank IE window appears.
If you see it hanging at 57%, rapidly click the cancel and reload icons on the IE browser. The flash movie then loads as expected - still in debug mode.
HTH

Copy link to clipboard
Copied
I had the same problem with a web application in Firefox, FB 4.7, Win 7 64-bit. What worked for me was both of the following:
- run FB as Administrator. (e.g., right-click the icon in the start menu and select Run As Administrator)
- if not running as Administrator, browse to the web application (e.g., go to localhost:8080/MyWebApp, or wherever your app is running). Once the app loads, the debugger kicks in.

Copy link to clipboard
Copied
I've actually found a couple of scenarios recently where the debugger failed to connect that in retrospect should have been obvious, but weren't up front. These are worth checking for as well:
- Check to make sure your swf is compiled with debug information (if you're working between Flash Builder and Flash Pro, the default when you compile from FP is to leave this information out).
- If you have some sort of process up front to get into the swf (for example you have to log in because you're testing that the credentials are being set properly via flash vars), make sure that the code isn't redirecting to a different location than you thought. I recently brought down code to localhost that someone else had written, and I couldn't figure out why the debugger wouldn't connect. It was because the code was hard-coded to launch a swf on the server which, you guessed it, had been compiled without debug info.
-
- 1
- 2
Get ready! An upgraded Adobe Community experience is coming in January.
Learn more
 AdChoices