 Adobe Community
- Home
- Illustrator
- Discussions
- Re: ExtendScript Debugger - 'Select Target Applica...
- Re: ExtendScript Debugger - 'Select Target Applica...

Copy link to clipboard
Copied
Hi all,
I had been using ExtendScript for a while and today it has suddenly stopped working. The bottom status bar had a yellow text with 'Select Target Application' this has now gone missing.
When I now attempt to run the script, I have to choose between 'Launch' or 'Attach'. I then have to choose between 'Main' and 'Transient' - I never had to do either of this before.
Would be most grateful if anyone can assist, as I have now gone back to manually performing tasks, which is extremely stressful.
Best Wishes


 1 Correct answer

I had been using ExtendScript for a while and today it has suddenly stopped working. The bottom status bar had a yellow text with 'Select Target Application' this has now gone missing.
The yellow status bar was removed during the transition from V1 to V2. This was done because the V2 extension now supports creating multiple simu
...Explore related tutorials & articles
 13
Replies
13
13
Replies
13

Copy link to clipboard
Copied
If you go to extensions (Ctrl + Shift + x), is ExtendScript Debugger enabled? (If you click the "manage" symbol, is "enable" an option in the menu?)
Copy link to clipboard
Copied
Thanks for your response - yes, it shows as 'enabled'.

Copy link to clipboard
Copied
Hi @Mgs0101, the ExtendScript Debugger has had a major upgrade to 2.0 (a complete rewrite) and uses different commands now. Please see the installation page for details. You will need to change your launch.json entry.
- Mark

Copy link to clipboard
Copied
Changing my launch.json to this worked for me.
{
    "version": "0.2.0",
    "configurations": [
        {
            "type": "extendscript-debug",
            "request": "launch",
            "name": "Illustrator",
            "hostAppSpecifier": "illustrator-26.064",
        },
    ]
}
I have a related questions though:
When I run "launch.json" VSCode hightlights the first line ("version": "0.2.0",) in red and shows this error:

The script is working. What is the error trying to tell me?

Copy link to clipboard
Copied
@sberic could say...
Copy link to clipboard
Copied
@rcraighead What does the full error notificatoin show? I'd guess that the file shown is "launch.json".
Your "launch.json"configuration doesn't specify a "script" property. As a result, it will send the contents of the focused file in VS Code to the target engine for debugging. If the file you had focused was, for instance, "launch.json" or some other non-JavaScript/ExtendScript file, then you are likely to see such an error.
Copy link to clipboard
Copied
I had been using ExtendScript for a while and today it has suddenly stopped working. The bottom status bar had a yellow text with 'Select Target Application' this has now gone missing.
The yellow status bar was removed during the transition from V1 to V2. This was done because the V2 extension now supports creating multiple simultaneous debug sessions at the same time. If you have more than one compatible application installed and you do not specify which application you wish to target in your "launch configuration" (launch.json file), then you will be shown a picker.
When I now attempt to run the script, I have to choose between 'Launch' or 'Attach'. I then have to choose between 'Main' and 'Transient' - I never had to do either of this before.
The new version of the extension supports more use cases than the old one. The Attach and Launch configurations enable different workflows. Based on the description of your troubles, it seems likely that the Launch configuration is what you're looking for.
Please note that you can create your own launch.json file and define a configuration that best matches your needs. For a configuration that will debug the "currently focused" script in Illustrator 2022's "main" ExtendScript engine, you could use the following for your launch.json file:
{
    "version": "0.2.0",
    "configurations": [
        {
            "type": "extendscript-debug",
            "request": "launch",
            "name": "Launch in Illustrator",
            "hostAppSpecifier": "illustrator-26.064",
            "engineName": "main",
        },
    ]
}
With this configuration in place, all you will need to do is hit the "Start Debugging" play button in the Run and Debug View.
Would be most grateful if anyone can assist, as I have now gone back to manually performing tasks, which is extremely stressful.
I hope that my (and others') responses will help reduce your stress from this transition. The new v2 version is decidedly more responsive and more stable than v1 versions. Hopefully after you get to work with it a bit and figure out the new workflow, it will disappear into the background.
I would very highly recommend spending a few minutes to read through/skim the new version's Readme. It has lots of detail and instructions for using the various features the extension enables.
One feature I feel that I should call out is that the new version of the extension provides a new command to evaluate a script without needing to run the debugger. As a short cut, it also provides a new status bar button that triggers that command. You can also bind the evaluation command to a specific set of shortcut keys and provide options that allow you to specify the host application/engine so that you don't have to pick from the list every time it's triggered.
There's a lot there that will hopefully help you streamline your development experience! Please give the new version a shot and let us know how it goes!
Copy link to clipboard
Copied
Thank you so much for such a detailed explanation, it is so greatly appreciated!
Thank you once again!
Copy link to clipboard
Copied
For anyone interested, here's my current setup for Illustrator.
• in my launch.json I have this configuration:
{
    "type": "extendscript-debug",
    "request": "attach",
    "name": "Start debugger—AI",
    "hostAppSpecifier": "illustrator",
}
(Aside: I don't bother with "engineName", but I think maybe I should? Feel free to advise me.)
• in my keybindings.json I have these entries:
{
    "key": "cmd+r",
    "command": "extension.extendscript-debug.evalInAttachedHost",
    "args": {
        "debugLevel": 1,
        "bringToFront": false
    }
},
{
    "key": "cmd+shift+r",
    "command": "extension.extendscript-debug.evalInAttachedHost",
    "args": {
        "debugLevel": 1,
        "bringToFront": true
    }
},
{
    "key": "cmd+.",
    "command": "extension.extendscript-debug.haltInHost",
    "when": "inDebugMode",
},
{
    "key": "ctrl+.",
    "command": "workbench.action.debug.stop",
    "when": "inDebugMode"
},
So when I start a debugging session I launch the debugger in "attach" mode, which means it stays connected. Then I use cmd+R to run the script I am currently editing. A small tweak is that I use cmd+shift+R to run the script and bring Illustrator to the foreground. I find while I am scripting I want to see console output first, and then see what happened in Illustrator second, so I like the option to not bring Illustrator to foreground.
The haltInHost command is useful if the debugger pauses on error and you want to halt it and run the script again. The debug.stop command stops the debugging session ("unattaches" the debugger).
My setup isn't sophisticated, but I thought it might help someone set up theirs. Comments welcome!
- Mark
Copy link to clipboard
Copied
Thanks so much for sharing your configuration, @m1b! I'll add just a few notes to hopefully provide some context:
- Details about locating the keybindings.json file are documented here.
- The first two key bindings bind to the "Evaluate Script in Attached Host" command. This is a different command from the "Evaluate Script in Host" command, though they share all custom arguments. (This is also the intended use! Very nice! 😉)
- Great use of the when-clause context in the halt/stop commands! I would consider those "advanced" properties that effectively make the keyboard bindings only work in certain contexts (i.e. "this keybinding will only work when '[inDebugMode]'").
As for the engineName property, you would only need/want that if you see the picker for a target engine when triggering the command and you always choose the same engine. If you find yourself clicking "main" every time, for instance, you might as well add "main" to the list of options. However, if the picker never appears, then it means that there was only a single engine active in the host application when the command was issued so it just assumed that engine (the default engine is usually named "main").
Copy link to clipboard
Copied
Thanks @sberic, that's good info. Yes with my simple setup I don't want to see any pickers. Now that I think of it, I'm pretty sure in my Indesign keybinding I had to choose engineName: "main" exactly as you say. But not in Illustrator.
- Mark

Copy link to clipboard
Copied
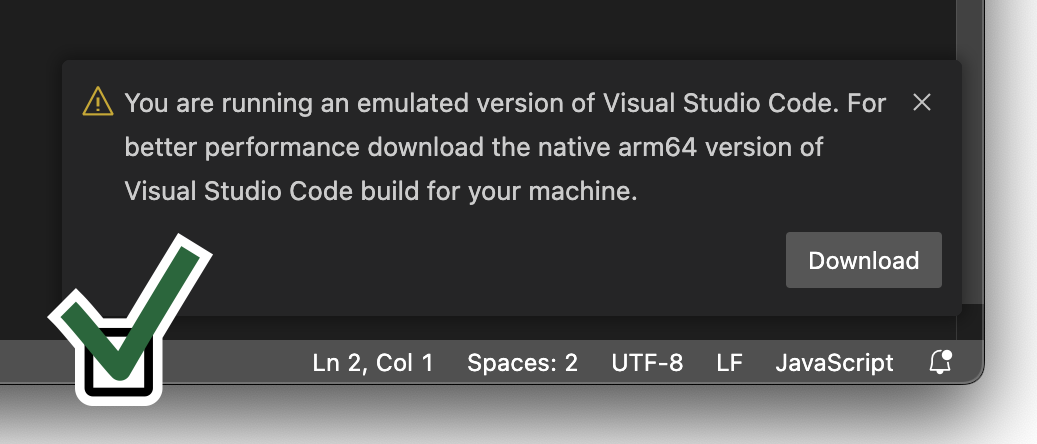
I've been drawn to this post multiple times, when I get that error. I am leaving this message to future me, and any other Mac users with the same problem:
Re-check if VSCode / Visual Studio Code has been opened with Rosetta.
I don't know why, and how, but my MacOS sometimes uncheck the box. Which leads me to the error. Rule of thumb: If you're not greeted with doom and gloom from Microsoft, you're not ready to interact with Adobe.
Command 'ExtendScript: Evaluate Script in Attached Host...' resulted in an error
command 'extension.extendscript-debug.evalInAttachedHost' not found
Copy link to clipboard
Copied
Hi @Societas Atheus, I had this problem too. There was a bug in VSCode that caused it to run in ARM mode whenever it had restarted after an update (which was fairly frequent).
I solved it be reinstalling the Intel-specific build of VSCode (not universal). In this case there is no way it can switch to the ARM binaries. You can choose this option at the VSCode download page.
(By the way, I also run a copy of ARM-only "VSCode Insiders". I use this for non-ExtendScript stuff. I choose insiders because it has its own bundle id which means we can pair different file types to launch whichever version you like—which you can't do if you have multiple copies of plain VSCode installed).
- Mark

 AdChoices