Copy link to clipboard
Copied
Hi all!
An (little urgent) question, hope someone can help me figure it out.
Found one video on this topic on YouTube on the but just can't get it working!
I made 3 different kinds of graphs in illustrator.
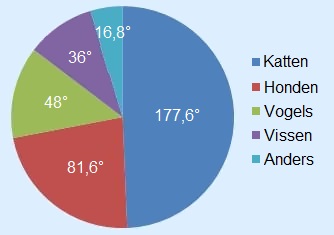
Now I want to add % and values into the graphs, just like in the attached examples.
I need this to filled in automatically, there is way too many data to do this by hand (with risks of mistakes).
Important:
- data should stay editable
- in Illustrator or InDesign
- The value or % should show/filled in automatically
Does someone know how I can get this working, our maybe a script/tool that can do it for me?
Many thanks!
This help document shows you how to do it:
https://helpx.adobe.com/illustrator/using/graphs.html#adding_pictures_and_symbols_to_graphs
To get the numbers with percentage into the bar, you will need to have 2 text objects: one is just a percentage sign, the other one is the placeholder for the value.
Configuring this in pie charts will be close to impossible, because they reset when editing the data. This might also happen with bar charts, but with pie charts it's almost certain to happen. You
...Copy link to clipboard
Copied
This help document shows you how to do it:
https://helpx.adobe.com/illustrator/using/graphs.html#adding_pictures_and_symbols_to_graphs
To get the numbers with percentage into the bar, you will need to have 2 text objects: one is just a percentage sign, the other one is the placeholder for the value.
Configuring this in pie charts will be close to impossible, because they reset when editing the data. This might also happen with bar charts, but with pie charts it's almost certain to happen. You might want to tackle pie charts in different ways (depending on what exactly it is you want to achieve.