 Adobe Community
RH2019 New - Scripting feature
Copy link to clipboard
Copied
Has anyone had a play with the scripting for RH2019 New? I'm just having a look with the idea of upgrading a bunch of ExtendScript scripts I wrote, but I'm somewhat lost.
The scripting guide says:
"Debugging Scripts
You can open the debug window by pressing 'Ctrl+Alt+D' to debug your scripts "
And it does open a debug window, but it seems to be debugging the RH application, rather than the script I want to debug? I tried the VariableConverter.js as a test.
Any tips for transitioning from ExtendScript to Javascript?
How does the Post Generation Script stuff work? The scripting guide all deals with RH interface stuff as far as I can tell, and I'm only familiar with javascript ephemerally modifying online html pages. Can it be run locally to make permanent file changes? Is there are good resource somewhere? Am I misreading the scripting guide?
Copy link to clipboard
Copied
Hello Amebr
The shortcut 'Ctrl+Alt+D' opens the debugger for the scriptiing window. To debug your script
1. Open the file 'scripting.js' in the Sources tab
2. Search for the function 'static execute(e)' in this file and put a breakpoint here
3. Now execute your script in RH2019 via the Scripts panel or the File menu. This breakpoint will be hit and the source for the script being executed will be received as an argument to this function. You can step into your source code from here after it is converted into a function.
There is no automatic conversion of Classic Extendscript syntax to the RH 2019 Javascript syntax but the data model of the application is similar and should be simple to write the same functionality in RH2019 Javascript.
Your script here works as Node.js script which has full access to the underlying operating system and can read/ write files similar to any native application. You can find a tutorial to the Node.js filesystem module 'fs' at https://www.w3schools.com/nodejs/nodejs_filesystem.asp. You can refer to the use of this 'fs' module in the sample scripts to access/ modify the project files in the sample scripts like VariableConverter.js.
Please feel free to inquire about any other information
Copy link to clipboard
Copied
Long time, no follow up. I'm now giving this a go.
I tried putting a breakpoint on 'static execute(e)' but nothing happened, so I moved it down to 'return new Promise'. But now I'm just debugging the scripting.js and path.js and...?
If you can provide keystrok by keystroke details that would be great as I'm not a developer.
Copy link to clipboard
Copied
Hello
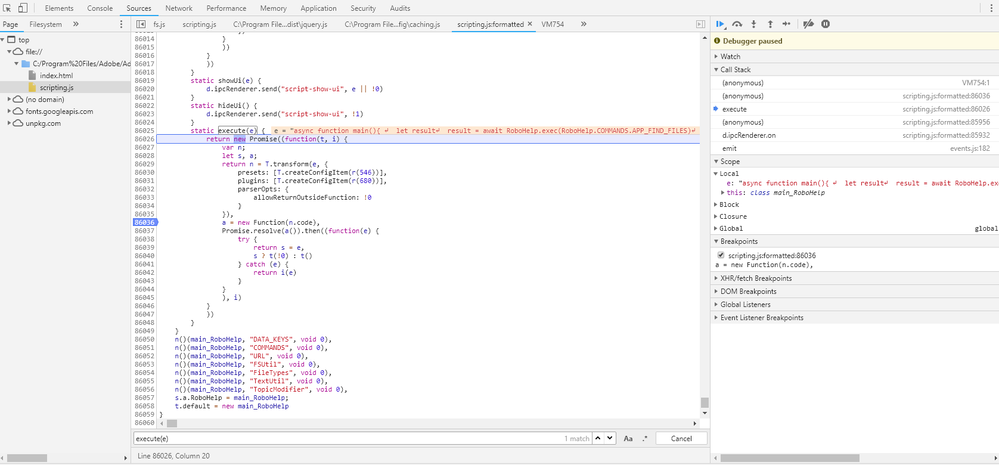
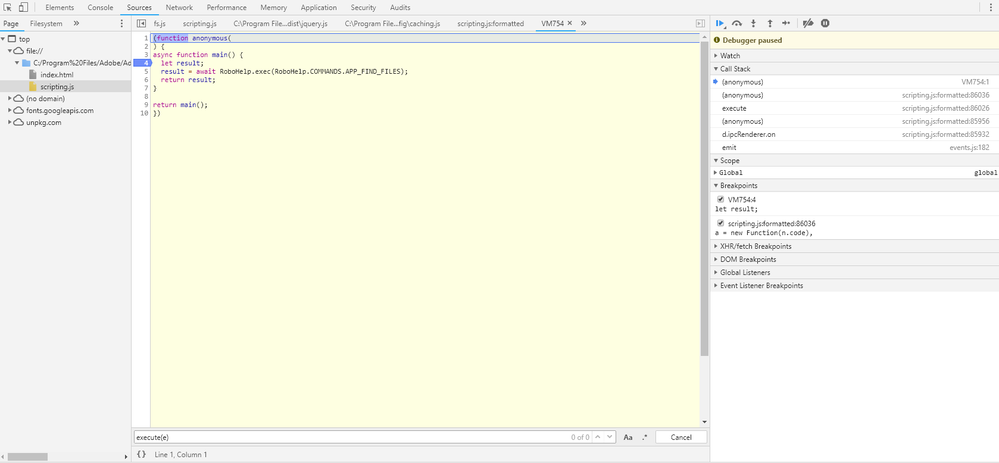
Please see the following screenshots for putting a breakpoint in your script.
1. Please put a breakpoint at this line in the execute() function
a = new Function(n.code)

2. Step into the function (the default shortcut is F11 or third button in the debug toolbar on the top right)
3. Your code should open up as a new tab. Put breakpoint at any desired location and use the debug toolbar to control execution.

This debugger is the standard Chrome DevTools window.
Basics of starting out with debugging, stepping through the code etc. can be referred to from here https://developers.google.com/web/tools/chrome-devtools/javascript
Copy link to clipboard
Copied
I'm reading through the tutorial you linked, but it's not really helping much. How do I open a File Open dialog box so I can select multiple files? Thanks.
Copy link to clipboard
Copied
Hello
Please use this snippet to launch the native Open File dialog to select files. This snippet uses the 'electron' module which is present available in the scripting context.
// Js snippet to launch Open File Dialog
const {dialog} = require('electron').remote;
dialog.showOpenDialog({
  properties: ['openFile', 'multiSelections']
  }, function (files) {
  if (files !== undefined) {
    console.log(files)
  }
});
Reference for this api
https://www.electronjs.org/docs/api/dialog
Copy link to clipboard
Copied
Thanks I'll give those a go.
I have a suggestions. It would be useful if the scripting guide listed all the javascript libraries included. A link to the documentation for each would also be a helpful reference. 🙂
Copy link to clipboard
Copied
Okay I can get to my script a bit easier now.
Next question. How to I cancel a script when I discover something has gone wrong or get into what I think is an infinite loop? (It happens a lot because I don't know programming and certainly not this all new programming.)
I searched online and found there is a Stop button in DevTools, but when I press it, if I try to run the script from RH again, it says "Last execution has not finished" (or similar words).
At the moment I have to completely close Robohelp and start again, which is not very convenient.
Copy link to clipboard
Copied
Yet another question. 🙂
Where does "console.log(files)" go when I'm not debugging? I can't find a View Log option for the scripts? The output pod in Classic is super useful to track what's going on when I'm running scripts and that's where I normally send progress messages, but I can't see a similar feature in RH New UI.
Copy link to clipboard
Copied
Switching to this thread (from this thread: ES Toolkit ) in order to add some additional comments. I also had difficulty figuring out where to set breakpoints and how to get debugging going w/scripts in the 2019 New UI. This is after revewing the scripting guide and also watching the previous TechComm events on scripting (from last fall). This is especially obscure when coming from the previous ES Toolkit-based scripting. It's also not clear that the old scripting infrastructure is still usable in RH2019 Classic and, by extension, that scripts for one (New UI vs. Classic) and not mutually transferable (scripts designed for New UI are not usable in Classic and vice versa).
More documentation/info on all of this would be useful and would have saved a fair bit of time. I'm going to start a new thread on a query I have about how to automate a couple RH2019 (Classic and/or New UI) sequences that I need to do frequently.
Copy link to clipboard
Copied
The new bit of code to search on to find the correct place to add a breakpoint seems to be:
static async execute(r)
then add the breakpoint on :
let a = new Function(s.code);Copy link to clipboard
Copied
I should have said "The new bit of code for RH2020.5"
Copy link to clipboard
Copied
I can't set a breakpoint in RH2019 Update 14 as the scripting.js file doesn't seem to pretty print any more. Can you provide any workarounds?
( I can't upload a screenshot for some reason. When pasting into the message the upload doesn't complete, and trying to use insert picture results in the message "Uploading the image resulted in an error" which provides no clues whatsoever.)