Flash mysteriously and partially disappears – please kindly help if you have time!!
Hello to all supportive and knowledgeable Flash developers around the world!!
Please please please help me for this very mysterious and strange problem!! I've tried to shorten the description to minimum, but please kindly spend 5-10 min to have a read!! And offer any insights...I am very desperate for some helps 
Some backgrounds
I am implementing a charting tool for my project, which is very similar to Google’s finance chart but much more tailored-made to meet different requirements. The charting interface is made up of the following core components:
- Time selection panel: to change the time span of the chart
- Measurement points panel: to select different points of measurement
- Chart area: to display the measurement data of the selected measurement points over the selected time span
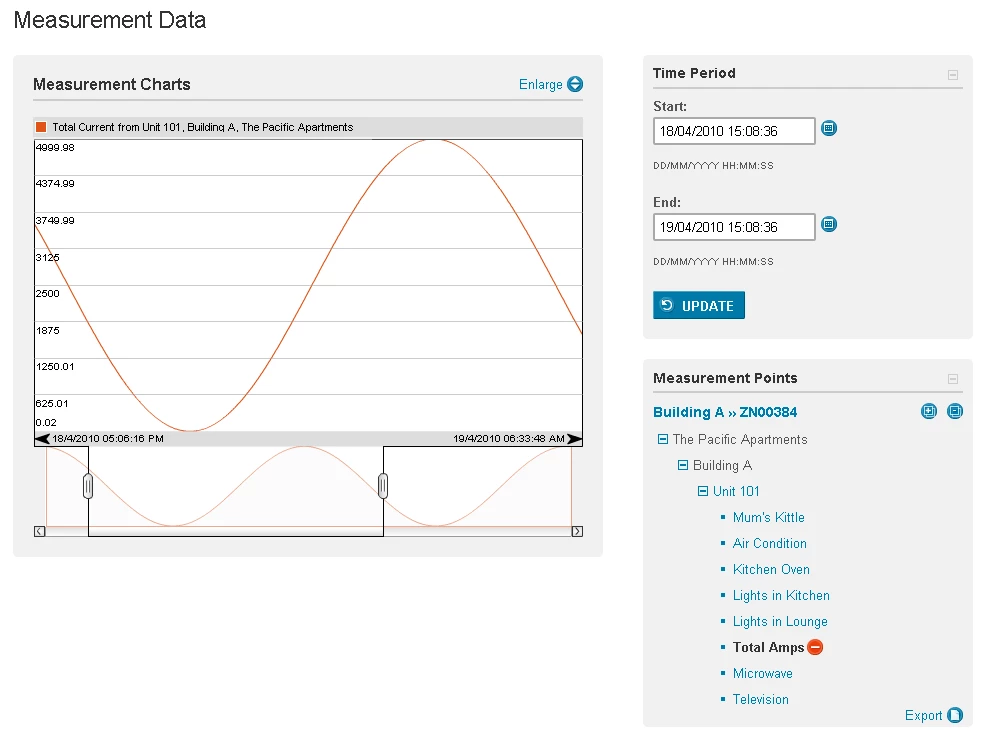
For example, the Apartment’s power administrator can view the total power consumption in Unit 101 of Building A, in the Pacific Apartment’s complex (a made-up name).
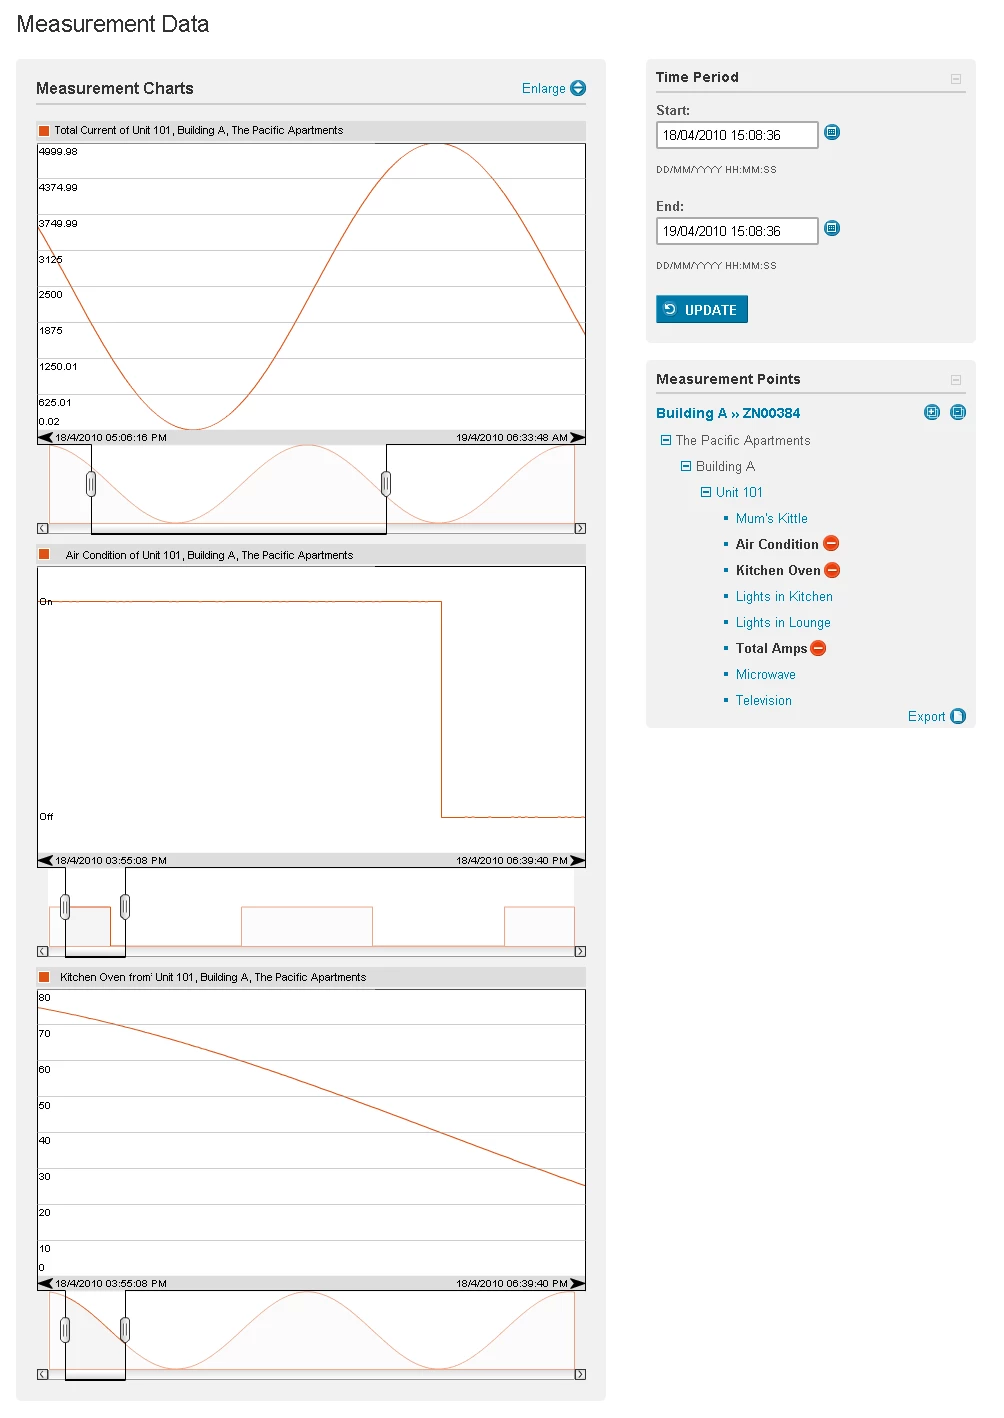
Similarly, the administrator can also “stack” up charts of multiple measurement points, having an all-in-one view like below:
Only the chart is implemented in Flash/AS3, the other panels are JSP, JavaScript and Dojo.
When an user clicks on a measurement point to add a chart to the chart area, the following things happen in order (briefly):
- User clicks on a link (say, Total Amps)
- Dojo event listener attached to the link picks up the mouse click event
- The Dojo event listener calls an AS3 method (addChart) through the External Interface to add a chart to the Flash chart:
- The Flash chart picks up the method call, adds a chart to the stage and reposition all charts on the stage. Since the stage height is fixed at 600 pixels, each chart added will be fitted into the 600 pixels. Eg, 1 chart on the stage = 600 px/chart, 2 charts = 300 px/chart, 3 charts = 200 px/chart…etc.
- This is what the Flash chart looks like, when 3 charts have been added, before display the chart on the actually page (see below)
- Once a chart has been successfully added to the stage, Dojo will stretch the <div> tag that the chart resides so that each chart still “looks” like 400 pixels tall. For example, 3 charts on the stage means each chart is 200 pixels tall, but Dojo will stretch the entire <div> to 1200 pixels, making each chart look like 400 pixels
- The above step is the same concept as resizing the stage
The problem!!!!
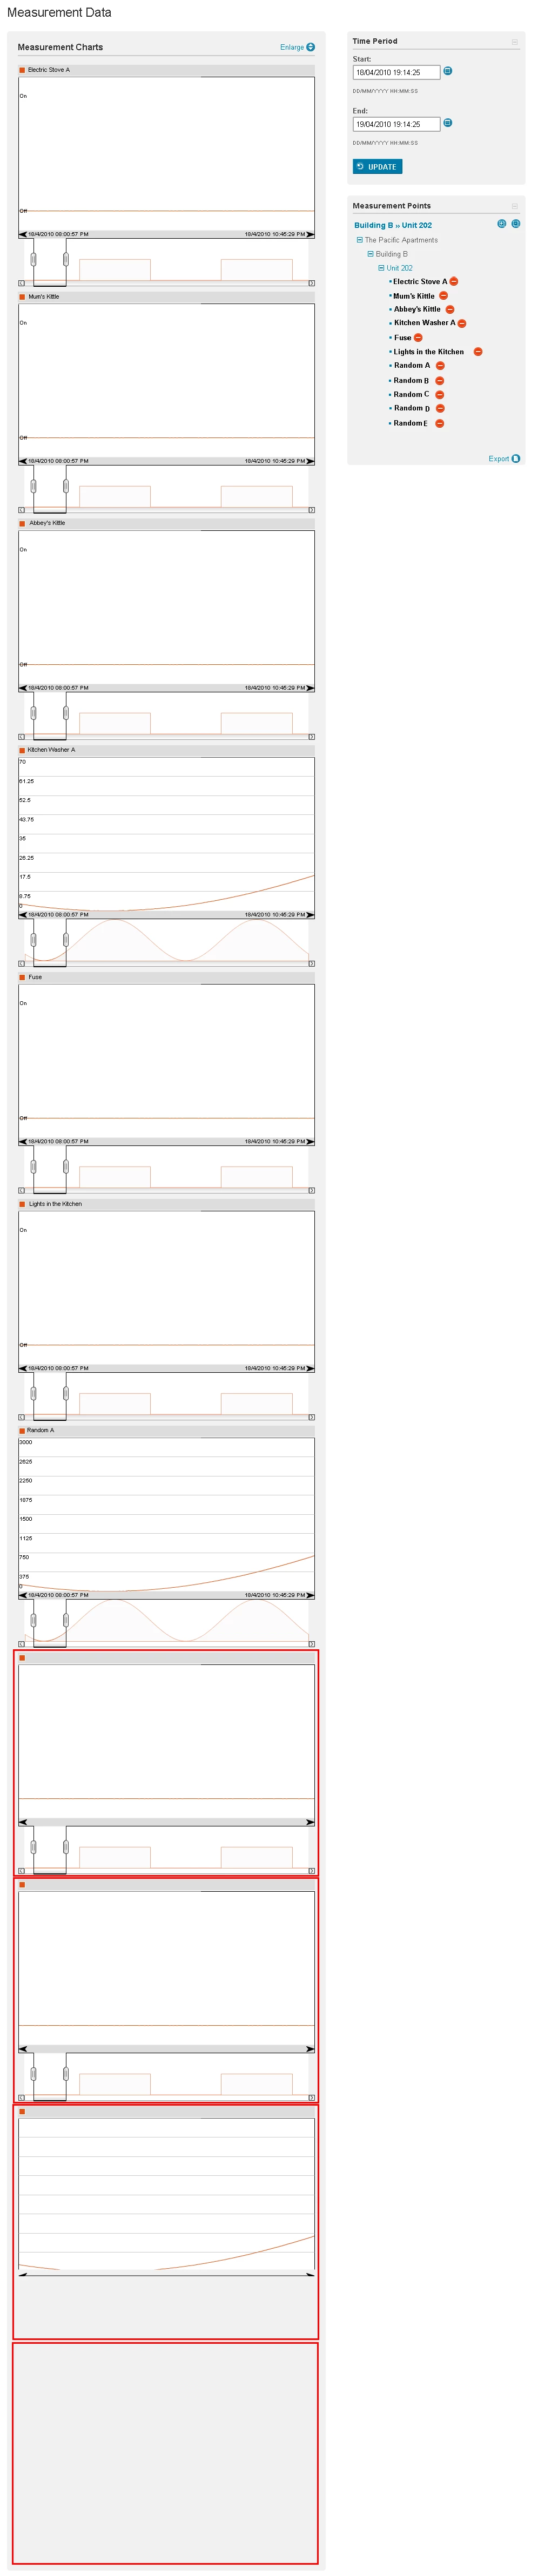
When an user adds more than 7 charts, the 8th chart will start have Flash contents disappeared. To be exact, I used firebug to increment the <div> height, and found that when height exceed 2924 (a magic number) pixels, Flash contents start to disappear. See below (the red-boxes indicate the missing contents)
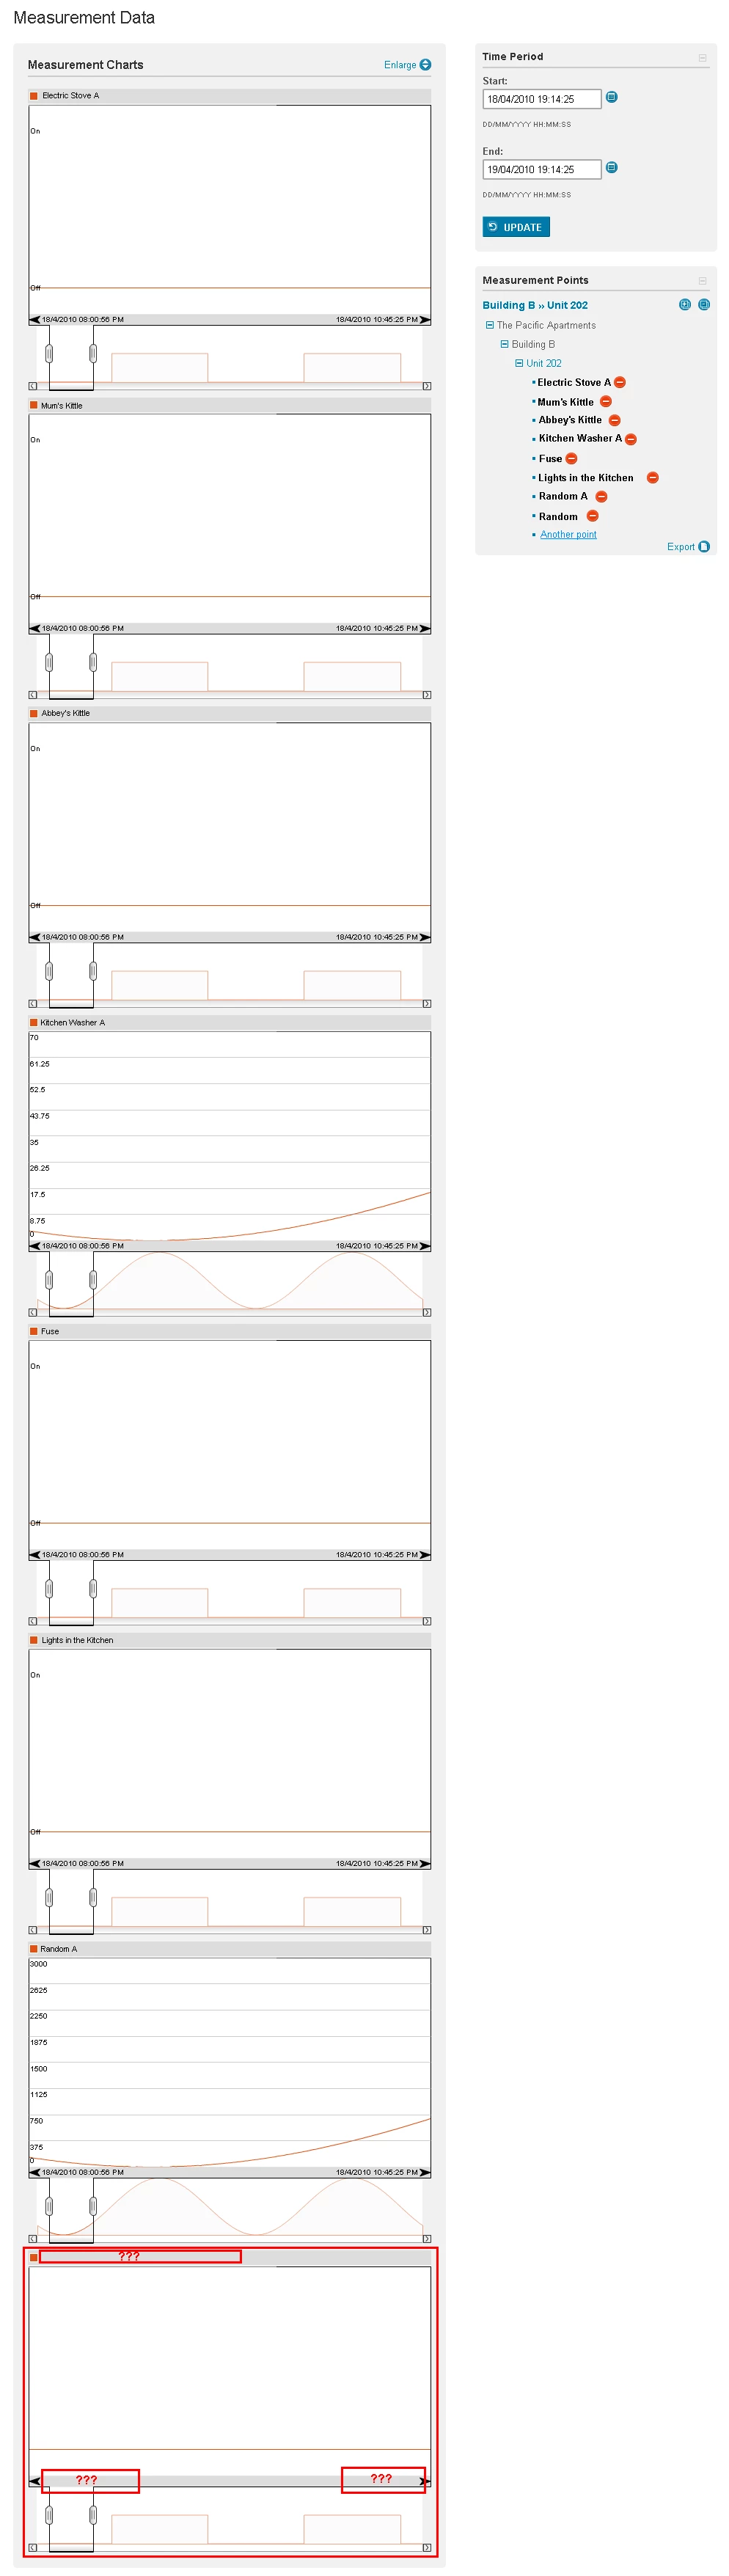
The situation gets worse when continue to add charts, eventually half of the bottom chart will disappear.
Some pre-work I have done:
- I have unit tested this component in standalone Flash movie, with 3 LCD monitors totalling 4000 pixels in height. I produced 10 charts in a single flash movie, and then resized the window from 600px to 4000px, no charts disappear.
- This happens in all of IE7, IE8, FF3+, and Chrome. Although slightly different manifestation, but they all have contents mysteriously disappeared.
- This also happens to GOOGLE's finance chart, when you enlarge the chart's <div> to over 10000 pxs (yet another magic number)
- The funny thing is, however, when a graph has been cut in half, the visible half is still operatable. For example, if the zoom window as been cut in half, I can still move it, zoom in and zoom out.
Please allow me to thank you heartfully, if you have finished reading all of the above information. At this point of time, any useful suggestions/solutions will be highly appreciated! Please help! THANK YOU!