saratogacoach
Inspiring
June 27, 2014
Answered

normal distribution graph to show data

  • June 27, 2014
  • 1 reply
  • 1755 views

In a survey, I am getting back user data (d Prime scores) that I would like to display on a normal distribution graph or chart, to give the survey taker a picture of where their score is on that normal distribution graph. Quite a challenge!

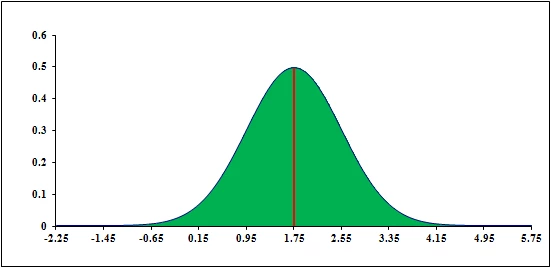
I can create the graph with the correct range, as a PNG, but am not sure how to set up AS3 script that could place the score in the correct location based on its specific value? For example (just the graph without any specific score),

Has anyone seen something like this that can visually display results? An example? (If there were a better way to display results, a different chart, etc. I would try that, as well.)

Any help appreciated.

This topic has been closed for replies.
Correct answer kglad

it's easy if you use the suggestion i made.

place that bitmap of a bell curve on the flash stage.

using the info panel place your mouse at -2.25,0 on that bitmap and note the x and y values in the info panel (eg, 100,400).

move your mouse to 5.75,0 on that bitmap and note the x and y values in the info panel (eg, 500,400).

to indicate a users score (eg, 2.1) on that bitmap, use:

var m:Number;

var b:Number;

var yPixel:Number = 400;

parameterF(-2.25,100,5.75,500);

graphF(2.1);

function graphF(xVal:Number):void{

var mc:MovieClip=new MC();  // where MC is the class you assign to whatever movieclip symbol you want to indicate the user's score

addChild(mc);

mc.x=m*xVal+b;

mc.y=yPixel;

}

function parameterF(x1:Number,y1:Number,x2:Number,y2:Number):void{

m=(y1-y2)/(x1-x2);

b=y1-m*x1;

}

1 reply

kglad
Community Expert
Community Expert
June 27, 2014

you could just fake it and assign their score using linear interpolation.

saratogacoach
Inspiring
June 27, 2014

Hi kglad,

Thank you for your reply. Currently, I am using a bar graph which moves up or down depending on score, adding one of 4 comments (highly negative, below average, above average, highly positive) based on data ranges. Not bad, but as mentioned, would like to provide, if possible, a reasonably accurate graphing, instead.

Sounds like it may not be possible without extensive scripting capability which I don't have. Or not possible at all.

kglad
Community Expert
kgladCommunity ExpertCorrect answer
Community Expert
June 27, 2014

it's easy if you use the suggestion i made.

place that bitmap of a bell curve on the flash stage.

using the info panel place your mouse at -2.25,0 on that bitmap and note the x and y values in the info panel (eg, 100,400).

move your mouse to 5.75,0 on that bitmap and note the x and y values in the info panel (eg, 500,400).

to indicate a users score (eg, 2.1) on that bitmap, use:

var m:Number;

var b:Number;

var yPixel:Number = 400;

parameterF(-2.25,100,5.75,500);

graphF(2.1);

function graphF(xVal:Number):void{

var mc:MovieClip=new MC();  // where MC is the class you assign to whatever movieclip symbol you want to indicate the user's score

addChild(mc);

mc.x=m*xVal+b;

mc.y=yPixel;

}

function parameterF(x1:Number,y1:Number,x2:Number,y2:Number):void{

m=(y1-y2)/(x1-x2);

b=y1-m*x1;

}