
Showing score on graph
Hi,
Still working on the eLearning project, trying to create a better way to display scores that the user receives after completing an exercise.
Scores for a larger group of exercise takers conforms to a normal distribution or bell curve. So a specific score could be shown on a normal distribution chart (550 X 268) like the following:

If the user's score is 2.55, could add a blue dot at the chart bottom to show that score:
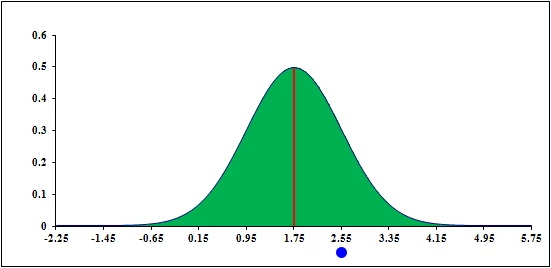
But the challenge is how to script this so that the score's blue dot is dynamically added in runtime? I've measured the X pixel distance between -0.65 (a useful end point) and 4.15 (another good choice for end point) and it is 285 px. 1.75 is at the midpoint = 285/2 or 142.50 px (+- from -0.65 or 4.15).
So, based on placement of the image on stage, choosing the correct registration point, accounting for (measuring and subtracting) the x distance from registration point to -0.65 in this example, a blue dot could be placed below -0.65 if the score were -0.65, and so forth, by setting the bluedot.x and visibility = true. Something like that?
These numbers would vary for different graphs with different samples (different means and standard deviations), but the pixel width between +- 3 (standard deviations) can always be measured and hard-coded in as variables.
But the script formula? Whew! So far, haven't been able to get my brain around this. (Maybe can leverage some of this discussion? : http://forums.adobe.com/message/4717869#4717869)
Any help appreciated.