Jay999999999999999
Known Participant
October 1, 2014
Question

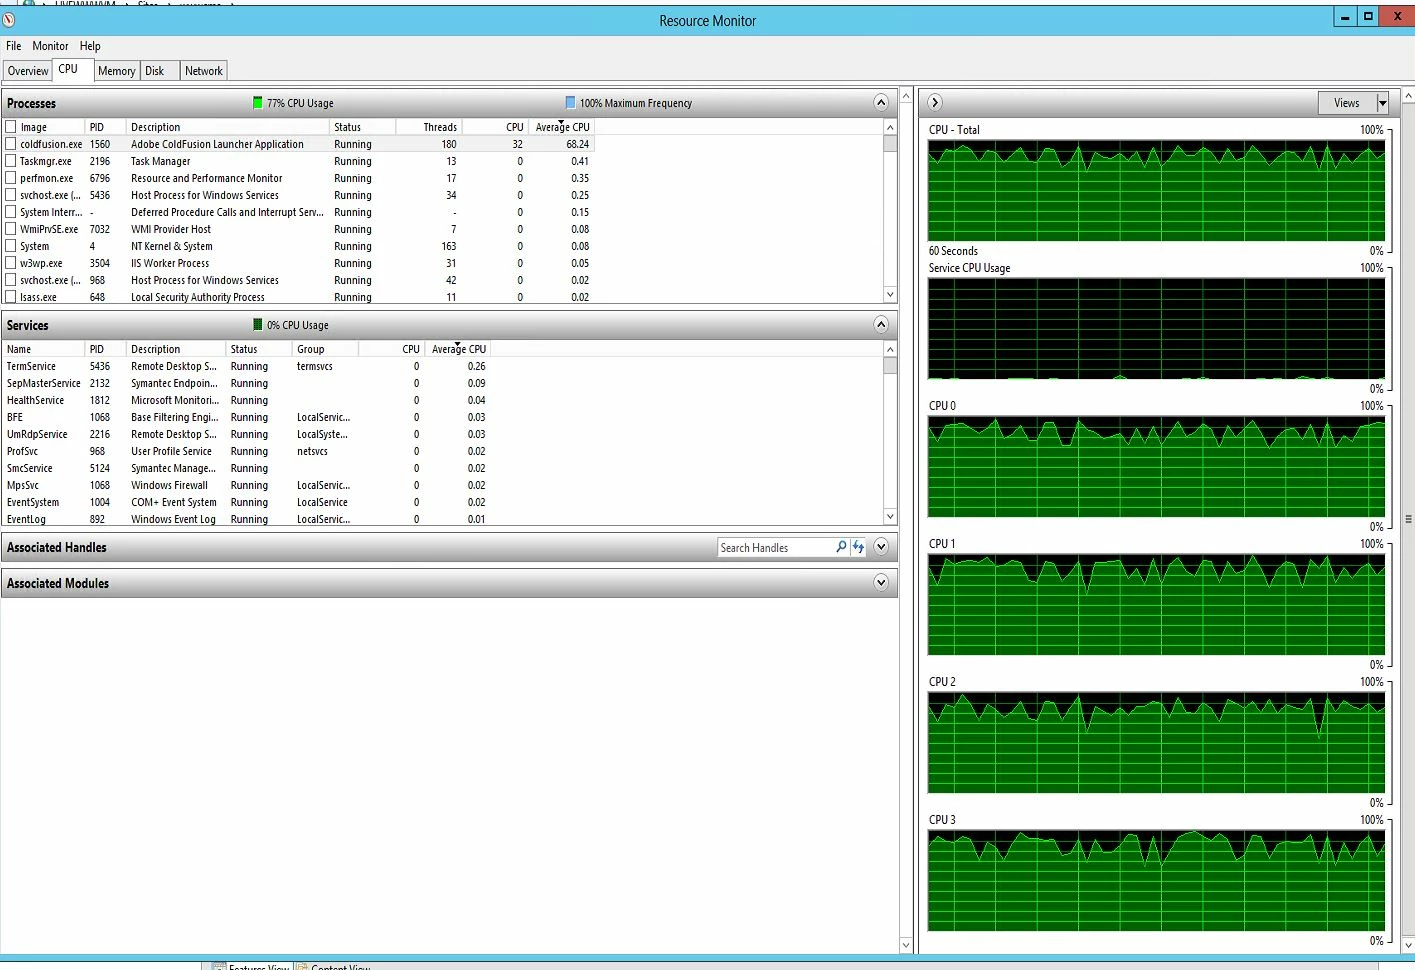
CF 10 sp 12 Enterprise high CPU usage hangs services, 2012 server on 2012 Hyper-V host

  • October 1, 2014
  • 1 reply
  • 1680 views

The last 2 days - my [removed link] CF site has suffered from high CPU usage (on and off) that stops functionality.

This will last several minutes then suddenly the high usage stops a few minute later the high cpu usage starts again.

I don't have any scheduled processes allowed to run.


Restarting the coldfusion service  during a high CPS incident - the cpu usage just picks up where it left off when restarted.

I have assigned 4 CPUs (normal) or 8CPUs  (as a test) to the VM and I get the same high CPU then low usage. This is a fresh install several months ago on a new VM.

I'd like some Adobe support on this issue but can't seem to find the contact phone number.

This series of high and low cpu usage first started Monday AM about midnight until 7:00 AM  Tuesday was quiet and Wednesday this AM I'm having the same issues.

Ideas?

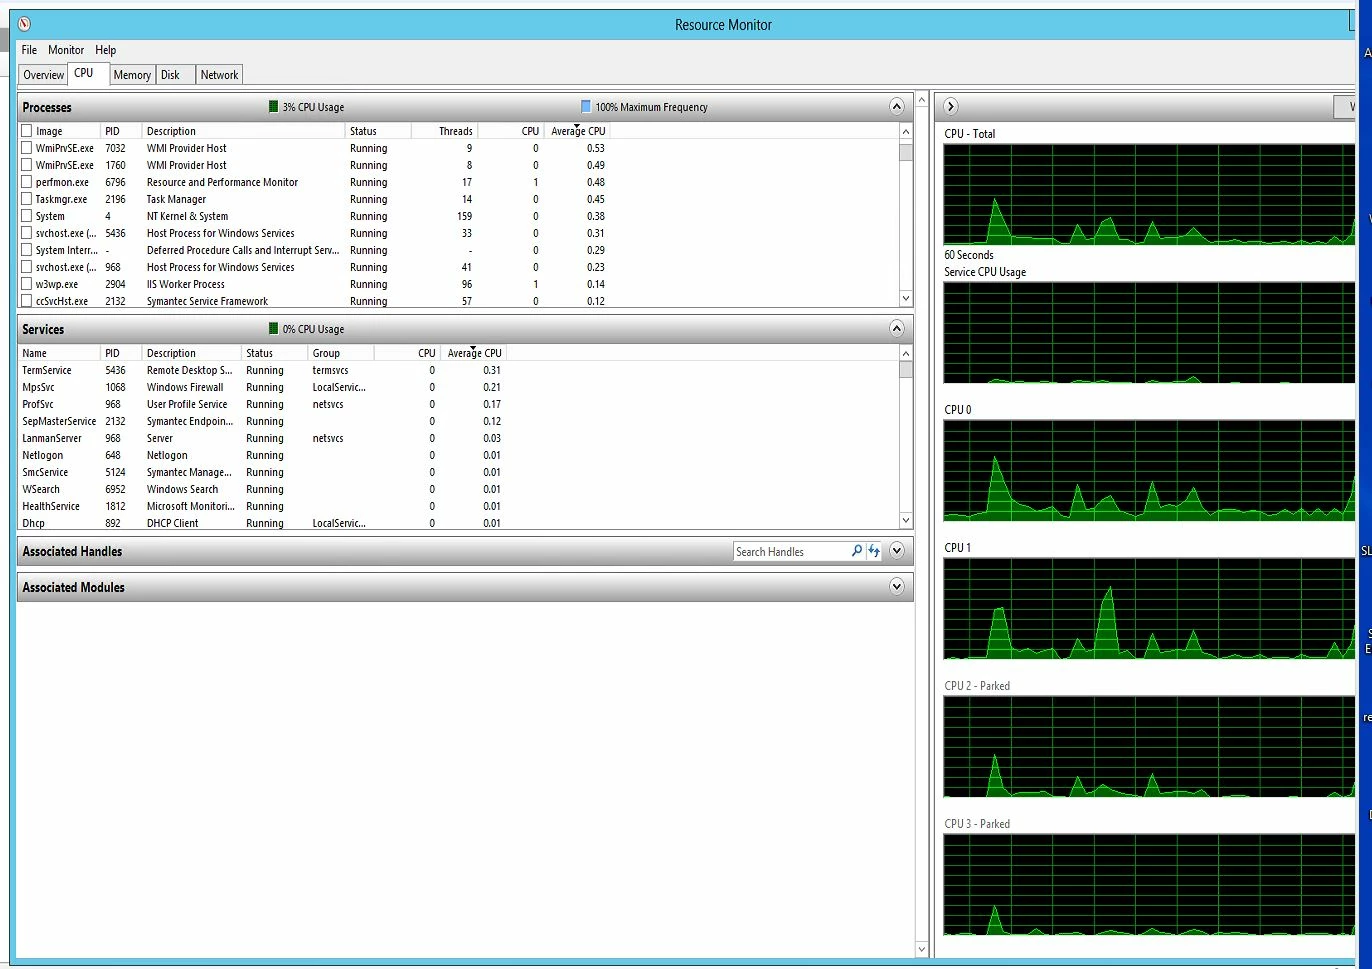
Update:  While waiting for this to post - the high CPU usage started again and this time I stopped and restarted the Jetty service ... and the CPU usage went away...

Update: the high cpu started again and a restart of the jetty service didn't help --- neither did the .net service restart... the cf10 application service did stop the high usage...

Jay Bietz

Message was edited by: Jay Bietz after post accepted.

    This topic has been closed for replies.

    1 reply

    Legend
    October 1, 2014

    Hi Jay,

    You have Enterprise so details gleaned from CF Monitor may help narrow down the cause of high CPU. Does CF Monitor - slowest active requests - show a particular program consuming resources? What does CF Monitor - JVM memory (used / max) MB - say about memory usage?

    You could do well to know if the CF tomcat thread / pools are bottlenecking. Will need JDK tools like Java Mission Control and JMX enabled in CF JVM settings to get a look at the tomcat usage. Many times error details in ISAPI log (ColdFusion10\config\wsconfig\N) can give you a hint that CF tomcat parameters need adjusting.

    HTH, Carl.

    Jay999999999999999
    Known Participant
    October 2, 2014

    Carl:

    Thanks for the ideas -- we found the offending and seldom used feature that when used was causing the massive CPU  load on the server  -- I'll research your suggestions as well as the original code and server to server communications.  We've removed the feature until more is known and it's fixed --- had a quiet night since the feature was removed:)

    "What does CF Monitor - JVM memory (used / max) MB - say about memory usage?"  I'm seeing during an event yesterday over a 1hour 40 period JVM memory max 926.00 MB used memory 728.84MB.  

    I have been watching the CF moniter, serve performance moniter and cf log files -- saw the slow down but hard to isolate the cause.  See below for illustration of a spike but how do I find out what caused it?

    Thanks again and I'll advise as needed here.

    Jay

    Jay999999999999999
    Known Participant
    October 2, 2014

    I have the jconsole working on a devlopment server - will do the production setup next week ... will be remote from my workstation etc.

    I searched the server for the Isapi  log file but didn't find any hits - I don't have one in the ColdFusion10\config\wsconfig\N area do have isapi_redirect.dll and .properties... nothing that looks like a log.

    Jay