prakasht82
Participant
March 16, 2016
Question

CF 11 Adobe ColdFusion Launcher Application- Maxing out CPU memory

  • March 16, 2016
  • 4 replies
  • 5559 views

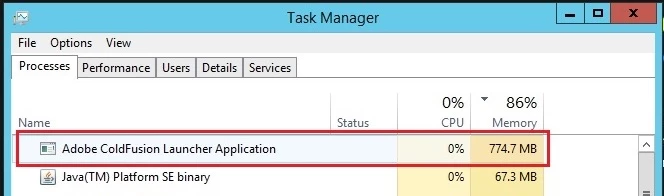
I have installed the Coldfusion 11 Standard Edition in Windows Server 2012 R2 with 2GB RAM and IIS 8.5. “Adobe ColdFusion Launcher Application” exe consumes more CPU memory in the process say around 86% and slows down or stops running the Application. The Application services goes down and URL throws Service unavailable error. Please help.


This topic has been closed for replies.

4 replies

traberc
Participant
April 5, 2016

We are also seeing this issue on two new web servers running CF 2016 Standard. The servers have 4 cores and 14GB memory.

We were getting "out of memory" errors from the Java garbage collector with the default heap size (512MB min, 1GB max), so I upped the max heap memory to 10GB. That fixed the "out of memory" errors, but we are still seeing the very high CPU utilization.

Inspiring
April 5, 2016

What is you app doing when it showing this CPU? Do you look at the CF server monitor or use any third parties like FusionReactor? The server monitor alone though be able to tell you what page / thread is running if there are any.

Usually CPU that high is because CF is trying to do something. For example, image processing etc, something intensive.

On a side note, do you use load balancers in front of these two servers?

traberc
Participant
April 5, 2016

We do not have any third party tools installed. The site uses basic CF, though it does generate a lot of charts. We did not have the same problem with CF11.

I would understand if the activity were spiky, but it's almost constant at 80-90% CPU, which is not usually normal for most applications. There aren't that many users and user activity on the server is not constant.

The two servers are behind a load balancer.

Community Manager
March 17, 2016

Hi Prakash,


For your email, one of our team members is working on this issue.

Thank You,

Abhishek

April 1, 2016

Hi Abhishek

I too have almost exactly the same issue although the percentage is 87%.  We also have a great deal more memory and no matter how much we throw at it, the percentage remains basically the same.  Also even when we restart ColdFusion, immediately it comes back it shoots straight up to 87%, with no users or processes interacting.

Has a solution been found for Prakash?

Thanks

Barb

Inspiring
April 1, 2016

What is your min and max memory settings set to for the CF JVM?

This usage could be normal depending on what you have configured.

Community Manager
March 16, 2016

Hi Prakash,

Could you please share your contact details to cf.install@adobe.com. Also please share the C:\ColdFusion11\cfusion\logs folder zip.

Inspiring
March 16, 2016

This depends on a number of things. The memory being used is what the JVM is set to. You can see this by going into the CF admin and choosing the JVM option from the menu.  I think the default minimum is 1024MB which is 1GB or 512MB.

Then it depends on what you are running in the application. Is this amount of memory enough for what you want to do? The 86% is not just CF, that is also the other applications, including OS processes, using the memory. The recommended requirements to run Server 2012 is 2GB alone, not leaving much for other processes to use.

If CF doesn't have enough memory to do what its doing then it will eventually starve and the process will die.