September 23, 2010
Question

cfchart: clips or crops my series marker at the top of the graph

  • September 23, 2010
  • 1 reply
  • 356 views

I am plotting a line chart. (aka Frame chart)
My series markers are begin clipped or cropped when the value is the  maximum. I have data from 0.0 to 10.0.  When the value is 10, it does not show  the complete marker.  I really don't want to have to set the scale to  11.  (make no sense as the values can never be greater than 10.0 and  looks really bad)

Is there a setting in the xml style that I am missing or is there a setting on the server that will increase the plot area so this does not happen?  I am using both the built in markers and custom markers but it makes no difference.  Both get cut-off.

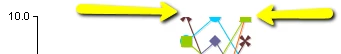
Example: Yellow arrows added for emphasis.  See how the markers are clipped/cropped.

    This topic has been closed for replies.

    1 reply

    September 23, 2010

    Kinda a what the ...
    Although the chart is only a 2d flat line chart, change this to a 3d  chart with a Zero rotation.  Do this in the .xml style file either  created by hand or using "webcharts.bat" to launch the chart editor and  create the file.  Do both items below

    • Remove is3D="false" (or set to true i.e. is3D="true") as part of the "frameChart" tag.  This is usual the second line of the xml file.
    • and add xDepth="0" yDepth="0 to the "frame" tag.  This is frequently the third line of the file.
      Note: no "is3d" and addition of "xDepth" and "yDepth".
    <frameChart autoAdjust="false" font="Arial-12-bold">
     
    <frame xDepth="0" yDepth="0" type="None" outline="black" leftAxisPlacement="Back" isHGridVisible="false" isHStripVisible="true" >
     
    <background minColor="#FDFEF6"/>
    </frame>