
Charts COLDFUSION 11?
Hello everyone, I have a problem with my charts after I switced form CF9 to CF11. My previous code in CF 9 was able to handle data with multiple years. After switch to CF11 my code gives me wrong chart. Looks like multiple years are combined together. Here is my photo of CF9 chart:
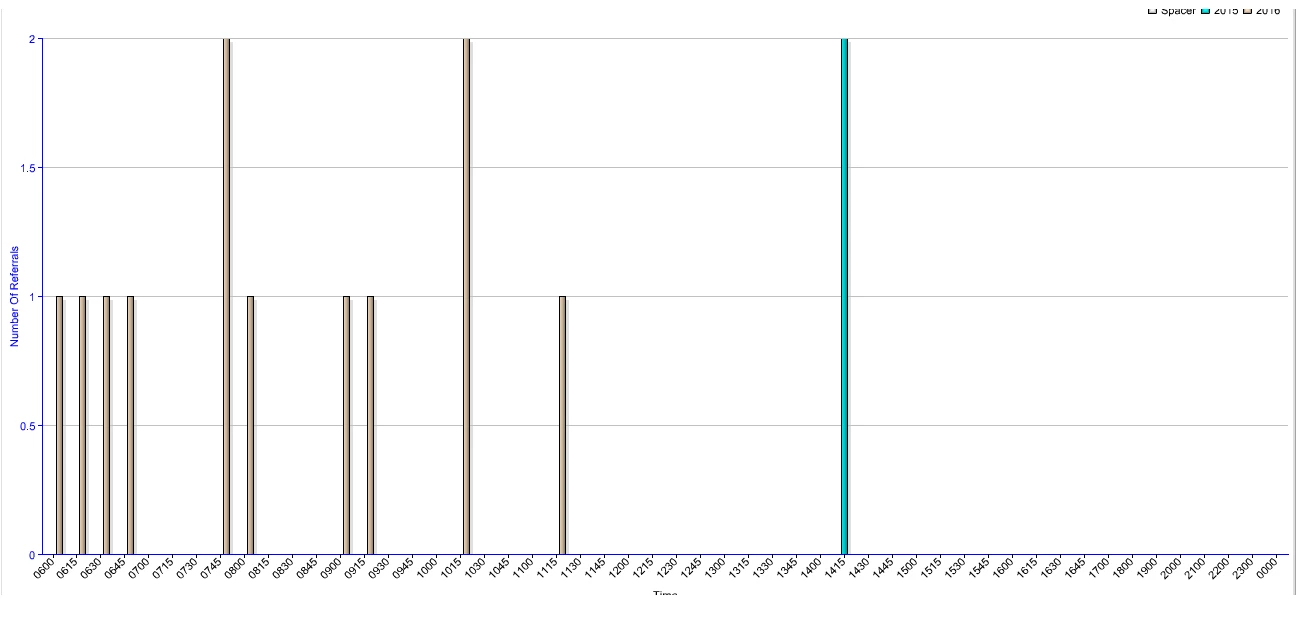
And her is my CF11 chart:
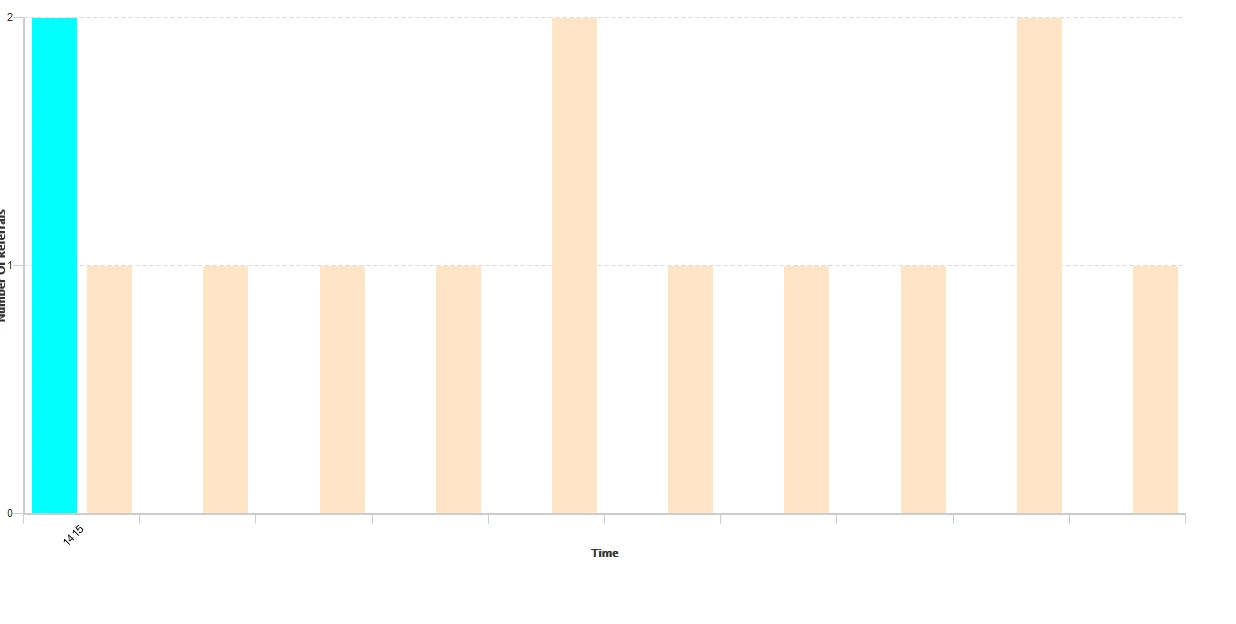
As you can see, in CF11 2015 year is first then 2016, but at the same time blue and yellow bar are in the same box. That should not be that way. Also I lost my time values on my x scale. Here is my code that I used in CF9:
<cfchart format="#ffPrint#" xaxistitle="#desc#" yaxistitle="#yTitle#" style="ChartStyle.xml"
chartheight="700" chartwidth="#graphWidth#" title="#title#" showlegend="#theLegend#" >
<cfchartseries type="bar" itemcolumn="Spacer" valuecolumn="" seriescolor="white" >
<cfoutput>
<cfloop list="#dataList#" index="i">
<cfchartdata item="#i#" value="0">
</cfloop>
</cfoutput>
</cfchartseries>
<cfoutput query="getRecords" group="theYear">
<cfchartseries type="bar" itemcolumn="#theYear#" valuecolumn="theCount" seriescolor="#listGetAt(theColors,colorIndex)#" >
<cfset colorIndex++>
<cfoutput>
<cfchartdata item="#Description#" value="#theCount#">
</cfoutput>
</cfchartseries>
</cfoutput>
</cfchart>
Does anyone know how this can be fixed? Is there any command in CF11 charts to check if data records and handle records with 0 value?
Thanks in advance.
