Known Participant
January 12, 2016
Answered

Integrated Pipeline Mode breaks my CF11, but Classic Mode does not

  • January 12, 2016
  • 1 reply
  • 1905 views

Hi,

I have ran into a problem, fresh after migrating  to IIS 8.5 (from IIS 6), CF 11.07-ent.

Does this make any sense to the pros out there?

Here is what I would see:
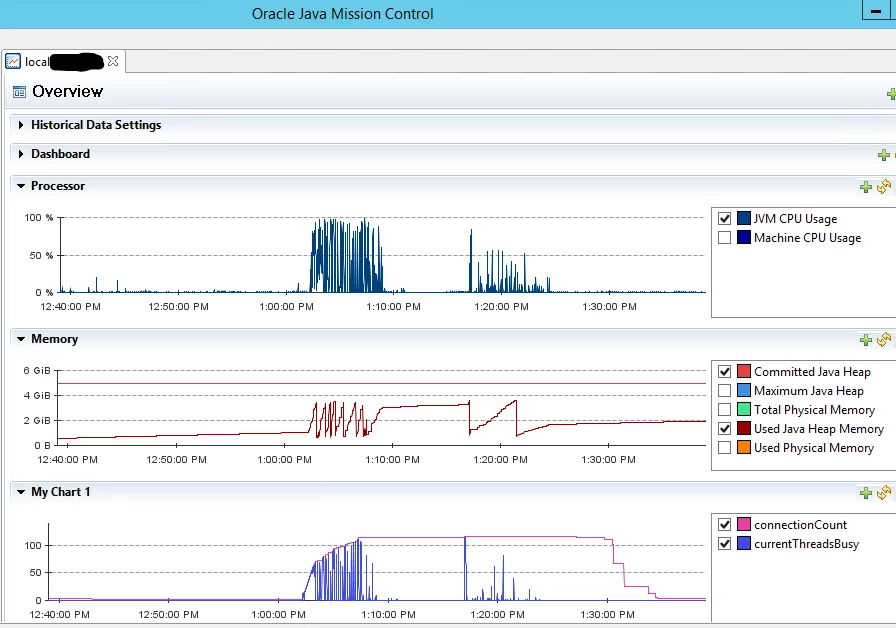
In taskman, as SOON as the Max JVM Heap memory was reached (for coldfusion.exe), CF would become partially or fully unresponsive.

I understand about connector tuning, and that is not the problem here. Here are the isapi_redirect log lines:

----------------
This first line shown below is the LAST line in the log having to do with connections (as you can see, I am a long way from maxing out. Also, my server.xml file's MaxThreads and Timeout are set to 1600 and 60000 and I only use one wsconfig/x, and one application pool, for a total of 1600 connections. I was very stable with these same numbers in IIS6)

[1532:3796] [info] ajp_process_callback::jk_ajp_common.c (2244): (cfusion) current reuse count is 91 of max reuse connection 800 and total endpoint count 1600

then hits error condition

[1532:3796] [info] jk_open_socket::jk_connect.c (817): connect to 127.0.0.1:8014 failed (errno=61)
[1532:3796] [info] ajp_connect_to_endpoint::jk_ajp_common.c (1127): (cfusion) Failed opening socket to (127.0.0.1:8014) (errno=61)
[1532:3796] [error] ajp_send_request::jk_ajp_common.c (1787): (cfusion) connecting to backend failed. Tomcat is probably not started or is listening on the wrong port (errno=61)
[1532:3796] [info] ajp_service::jk_ajp_common.c (2903): (cfusion) sending request to tomcat failed (recoverable), because of error during request sending (attempt=2)
[1532:3796] [error] ajp_service::jk_ajp_common.c (2924): (cfusion) connecting to tomcat failed (rc=-3, errors=178, client_errors=478).
[1532:3796] [error] HttpExtensionProc::jk_isapi_plugin.c (2763): service() failed with http error 503


(I also occasionally see the following too)
[1532:14080] [info] ajp_connection_tcp_get_message::jk_ajp_common.c (1401): (cfusion) can't receive the response header message from tomcat, tomcat (127.0.0.1:8014) has forced a connection close for socket 5684
[1532:14080] [error] ajp_get_reply::jk_ajp_common.c (2376): (cfusion) Tomcat is down or refused connection. No response has been sent to the client (yet)

Once the error condition starts, then these error lines repeat many many times (with different thread number ... ie [1532:xxxxx] where 1532 is the PID for the IIS worker process for the application pool I am in).
----------------------
CF then either hangs, or occasionally comes back on its own (maybe 20-30 minutes later) and the isapi_redirect.log resumes logging normal activity (no more errno=61).

----------------------
Then I turn OFF Integrated Pipeline mode (making it classic), reset, and the problem goes away.

I am a pure CF shop, no .NET or .ASP, just CF and static HTML on my IIS. I do not need Integrated mode. But since I have read on google that Jakarta/CF is "supposed" to play nice with Integrated Mode, I am very concerned my problem is a canary in a coal mine, ESPECIALLY since it triggers right when Max JVM is reached(!) which should have nothing to do with that since this is just committed, not used, memory, right? It does not make sense to me.

My clue summary: CF instability/hangs are triggered right when MAX JVM Heap is reached (as shown in taskman for coldfusion.exe),  AND I use Integrated Pipeline Mode instead of Classic mode. (Improper connector tuning is not implicated in this situation).

Opinions?
Thanks!
Byron_K

    This topic has been closed for replies.
    Correct answer carl type3

    Thanks very much Carl,

    I think I made some headway, but I want to wait to report fully so I am not jumping any conclusions again (has to do with configurations of my IIS6 app pool recycling vs. the IIS8.5 setup, but perhaps a bit of a Band-Aid fix. I'll post fully the results).

    You asked for my server.xml's ajp section, I will also provide my workers.properties ... all below.

    Thanks for the GC tip. I plan now to look at a more serious monitoring tool.

    Question: are there known conditions that can cause these {errno=61, attempt=2, connecting to tomcat failed} conditions OTHER THAN connector mis-tuning?? My impression (and so much on google) is that it is all about proper connector tuning, and if you have that, then you would not see these errno=61's at all. But perhaps I am naïve and perhaps, for example that when you say "Java could still be suffering for a problem with non heap Metaspace", that you also mean(?) that that would cause these errors {errno=61, attempt=2, connecting to tomcat failed} to get logged in the isapi_redirect.log(?)

    Question: during the times of stalls when I see these {errno=61, attempt=2, connecting to tomcat failed} errors and I am not out of connectors, IF I can successfully telnet to port 8014, does that help narrow down the component(s)  that are at fault?

    Much appreciation!

    Byron

    ===============

    supporting info:

    workers.properties

    -------

    worker.list=cfusion

    worker.cfusion.type=ajp13

    worker.cfusion.host=localhost

    worker.cfusion.port=8014

    worker.cfusion.max_reuse_connections=800

    worker.cfusion.connection_pool_size=1600

    worker.cfusion.connection_pool_timeout=60

    server.xml (the port 8009 typo in description is how it came from Adobe)

    ---------

        <!-- Define an AJP 1.3 Connector on port 8009 -->

    <!-- begin connector -->

        <Connector port="8014" protocol="AJP/1.3" redirectPort="8447" tomcatAuthentication="false" maxThreads="1600" connectionTimeout="60000" />

        <!-- end connector -->

    ---------

    Also, I subscribe to Pete's HackMyCf and his report says I am current on everything, including this:
    CF11/Tomcat IIS AMD64 isapi_redirect.dll   2015-09-10   (and then the MD5) and it says "Up to date".


    Welcome Byron,

    Thanks for the reminder - should always check CF update level and if matching isapi_redirect.dll is applied.

    Lets say I find the details in isapi_redirect.log "secret CF tomcat business", that is not well documented anywhere. Sometimes the log content is lacking useful detail or periods of information when you know usage is occurring. Certainly web searching seems to provide lots of queues to do tomcat tuning given this or that message. What I notice - when the Java part of CF is down or in the process of having a problem

    the ISAPI log is most verbose.

    If you are going to look at the CF Java memory use and GC matters you can do well to enable JMX with JMC (JDK tool Java mission control, suggest version 5.4 and above in JDK 1.8u45 or greater). Why so? It is free ($) and you can get to see not only heap, non heap but what tomcat is doing as well.

    JMC EG:

    Regards, Carl.

    1 reply

    Legend
    January 12, 2016

    Hi Byron,

    Max JVM Heap can be committed with objects. Is there available RAM so you can just increase the value for Max JVM Heap?

    Perhaps enabling some Java logging or Java management extensions (JMX) along with using JDK tools like JMC or jconsole to see what the heap or non heap is doing will help to know what is wrong.

    HTH, Carl.

    Known Participant
    January 12, 2016

    Thanks for weighing in Carl. I respect your experience.

    However, WHY the problem only with Integrated? Using the built in CF server monitor (in Enterprise), I see my memory is stable, and functioning properly, and GC is taking place as expected.

    Bizarre. I have JVM set to 24 Gig, and use but a very small % of it, so I don't think that is it...

    Known Participant
    January 12, 2016

    EDIT: by poster: I think I maybe should start a new post since I mangled the subject line(?) (end edit)

    ---

    Update: first of all, I apologize for rushing to conclusion. I acknowledge massive face-egg syndrome, and apologize. Although the pipeline mode seems to make things more stable, it may be a red herring since we had another crash this morning (the first one using Classic pipeline mode).

    Here are my CF logs. I think I have exhausted my current resources (?) and would love a nudge on how to proceed in solving this. Thanks. (I also include a screen shot of CF-ent's Server Manager memory use during time of crash. I also audited my Windows scheduler logs and event logs and I could find nothing at all that happened at the time of CF crash time (8:32 as seen below).)

    -----

    LOGS snips during crash:

    ----

    ISAPI_redirect.log

    .

    . logs a new connection

    .

    [Tue Jan 12 08:32:21.033 2016] [15416:7284] [info] ajp_process_callback::jk_ajp_common.c (2244): (cfusion) current reuse count is 109 of max reuse connection 800 and total endpoint count 1600

    .

    . ERRORS START, users report slowdowns and stalls, yet some users still running OK

    .

    [Tue Jan 12 08:32:34.783 2016] [15416:14472] [info] jk_open_socket::jk_connect.c (817): connect to 127.0.0.1:8014 failed (errno=61)

    [Tue Jan 12 08:32:34.786 2016] [15416:14472] [info] ajp_connect_to_endpoint::jk_ajp_common.c (1127): (cfusion) Failed opening socket to (127.0.0.1:8014) (errno=61)

    [Tue Jan 12 08:32:34.788 2016] [15416:14472] [error] ajp_send_request::jk_ajp_common.c (1787): (cfusion) connecting to backend failed. Tomcat is probably not started or is listening on the wrong port (errno=61)

    [Tue Jan 12 08:32:34.792 2016] [15416:14472] [info] ajp_service::jk_ajp_common.c (2903): (cfusion) sending request to tomcat failed (recoverable), because of error during request sending (attempt=1)

    . REPEATS 410 times, except the "14472" changes, although blocks of the same thread ID do repeat during this error state. For instance, besides the one "block" for 14472 shown above, there are 14 blocks for 14472 just like above, before the system corrects itself below.

    .

    . Scheduled tasks : some "misfire" during this period but some run. The event below is scheduled to run every 2 minutes and it failed the first time and one other time during the "down time" but it also ran 10 times during the down time with no errors .

    .

    Jan 12, 2016 08:32:50 AM Information [DefaultQuartzScheduler_QuartzSchedulerThread] - Task default.CF - IIS running, cks SQL, writes to X: misfired.

    Jan 12, 2016 08:34:28 AM Information [DefaultQuartzScheduler_Worker-5] - Task default.CF - IIS running, cks SQL, writes to X: triggered.

    .

    . There is also LOTS of valid activity in the coldfusion-out.log during this 'crashed' period, so some connections continue to work (maybe the ones that were already open?), such as:

    .

    Jan 12, 2016 08:35:05 AM Information [ajp-bio-8014-exec-627] - Starting HTTP request {URL='http://www.redacted.com/fam', method='GET'}

    Jan 12, 2016 08:35:05 AM Information [ajp-bio-8014-exec-795] - Starting HTTP request {URL='http://redacted.com/f?l=5DowW1EneRtU&i=111.222.111.222', method='get'}

    Jan 12, 2016 08:35:05 AM Information [ajp-bio-8014-exec-795] - HTTP request completed  {Status Code=200 ,Time taken=73 ms}

    Jan 12, 2016 08:35:06 AM Information [ajp-bio-8014-exec-627] - HTTP request completed  {Status Code=200 ,Time taken=871 ms}

    .

    . BACK to the isapi_redirect.log showing last batch of errors, then seems to corrects itself by finally establishing a new connection (15 minutes later). At that point, CF seems happy again and the errno=61's stop. Dodged a bullet since it doesn't always recover and I must reset to fix

    .

    [Tue Jan 12 08:44:33.149 2016] [15416:15608] [info] jk_open_socket::jk_connect.c (817): connect to 127.0.0.1:8014 failed (errno=61)

    [Tue Jan 12 08:44:33.167 2016] [15416:15608] [info] ajp_connect_to_endpoint::jk_ajp_common.c (1127): (cfusion) Failed opening socket to (127.0.0.1:8014) (errno=61)

    [Tue Jan 12 08:44:33.181 2016] [15416:15608] [error] ajp_send_request::jk_ajp_common.c (1787): (cfusion) connecting to backend failed. Tomcat is probably not started or is listening on the wrong port (errno=61)

    [Tue Jan 12 08:44:33.192 2016] [15416:15608] [info] ajp_service::jk_ajp_common.c (2903): (cfusion) sending request to tomcat failed (recoverable), because of error during request sending (attempt=2)

    [Tue Jan 12 08:44:33.208 2016] [15416:15608] [error] ajp_service::jk_ajp_common.c (2924): (cfusion) connecting to tomcat failed (rc=-3, errors=135, client_errors=166).

    [Tue Jan 12 08:44:33.225 2016] [15416:15608] [error] HttpExtensionProc::jk_isapi_plugin.c (2763): service() failed with http error 503

    .

    Tue Jan 12 08:44:38.821 2016] [15416:14472] [info] ajp_process_callback::jk_ajp_common.c (2244): (cfusion) current reuse count is 110 of max reuse connection 800 and total endpoint count 1600

    (end log snips NO MORE errno=61, CF returned to 'normal' this time. Other times, it will continue with errno=61 until I reset. *EDIT: When it doesn't recover, users start getting the Jakarta/isapi's 'Service Unavailable' white screen until I reset)

    ----------------------------------

    Screen shot of CF-ent's Server Manager for this time period (seems to show proper operations and certainly no memory issues that I can see)

    ...

    Thank you for any considerations on this, I am a bit frustrated since our IIS6 CF11-ent installation ran stable : NEVER this error. Thus I am a bit rusty at trouble-shooting CF issues like this.

    Byron