Known Participant
October 8, 2024
Question

Possible Memory Leak - ColdFusion 2023 + Java 17.0.12

  • October 8, 2024
  • 6 replies
  • 11092 views

Ever since we upgraded from ColdFusion 2021 to ColdFusion 2023 we have been dealing with out of memory issues. ColdFusion will run fine for roughly 24-30 hours, then we will start seeing CPU spikes to 100% every 30 seconds. Garbage collection can't free up enough memory so ColdFusion eventually crashes and we have to restart the server.


Things we have tried that don't seem to help:


- Downgrading to 17.0.11

- Tweaking the min and max heap sizes

- Tweaking the caching settings

- Changing the garbage collector algorithm to G1GC

- Tweaking our websites to cache queries for a shorter period of time (1 hour down to 15 minutes down to 5 minutes)


Here are our current settings:


Min Heap: 8192

Max Heap: 8192

Garbage Collector: UseParallelGC

Cached Templates: 1000

Cached Queries: 5000


We do have Fusion Reactor installed on all of our servers but this is like trying to find a needle in a haystack. I really don't know what I should be looking at.


Here is a most recent screenshot from 2 days ago that shows the ventual demise on one of our servers.


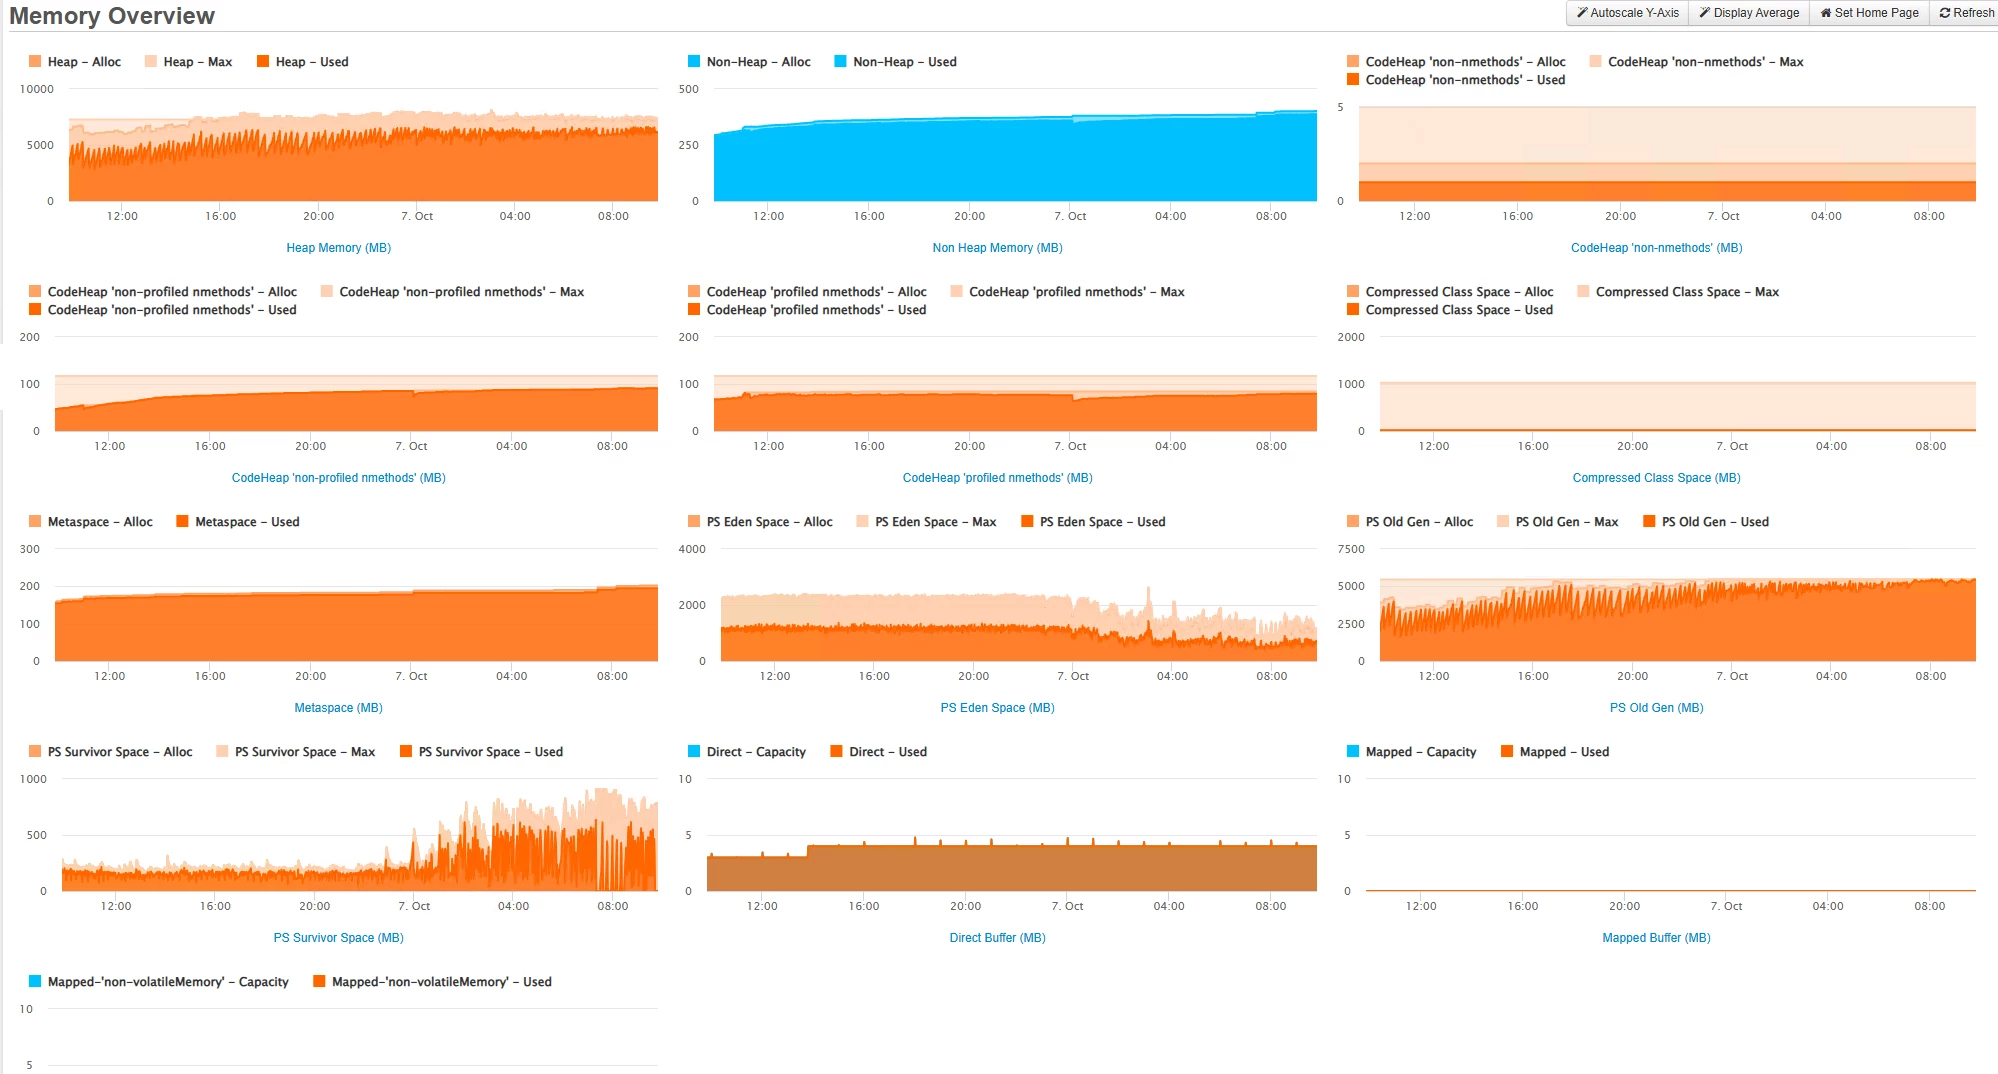
I am really at my wit's end here. If this isn't a memory leak I don't know what the heck it is. If anyone has any recommendations on what to try next I would appreciate it.

    6 replies

    Inspiring
    November 5, 2024

    I have the same issues, someone could help to understand what is wrong?
    I have a server with CF2018 running without problems and now with CF2023 server cannot stay live for more than 6 hours, then it becomes unresponsive because of the heap becoming full.


    This is how it looks when become unresponsive.

    And this is the memory situation

     The old gen memory grows and the eden space becomes thinner. I tried also zGC but the result is the same. Is there a way to make this thing working?

    Salvatore Cerruto
    Known Participant
    November 5, 2024

    It looks like you're getting spikes in JDBC activity when the CPU spikes occur. Could it be a poor performing query?

    BKBK
    Community Expert
    Community Expert
    October 14, 2024

    @davecordes , Have you tried my cfdump suggestion? If so what were the file sizes? 
    (Given that the code is all there, the test should take you all of 45 seconds.)


    Could you also share the contents of jvm.config?

    Known Participant
    October 14, 2024

    BK,


    Yes I did try your dump suggestions. The files were pretty small.


    - applicationScopeDump.html was 118K B

    - sessionScopeDump.html was 10 KB


    JVM Config


    #
    # VM configuration
    #
    # Where to find JVM, if {java.home}/jre exists then that JVM is used
    # if not then it must be the path to the JRE itself
    
    java.home=D:/Java/jdk-11.0.24
    
    #
    # If no java.home is specified a VM is located by looking in these places in this
    # order:
    #
    #  1) ../runtime/jre
    #  2) registry (windows only)
    #  3) JAVA_HOME env var plus jre (ie $JAVA_HOME/jre)
    #  4) java.exe in path
    #
    
    # Arguments to VM
    
    java.args=-server  -Xms8192m -Xmx8192m --add-opens=java.rmi/sun.rmi.transport=ALL-UNNAMED --add-opens=java.base/java.nio=ALL-UNNAMED --add-opens=java.base/java.lang=ALL-UNNAMED --add-opens=java.base/sun.util.cldr=ALL-UNNAMED --add-opens=java.base/sun.util.locale.provider=ALL-UNNAMED --add-opens=java.base/java.net=ALL-UNNAMED --add-opens=java.base/java.io=ALL-UNNAMED -XX:+UseParallelGC -Djdk.attach.allowAttachSelf=true -Dcoldfusion.home={application.home} -Duser.language=en -Dcoldfusion.rootDir={application.home} -Dcoldfusion.libPath={application.home}/lib -Dorg.apache.coyote.USE_CUSTOM_STATUS_MSG_IN_HEADER=true -Dcoldfusion.jsafe.defaultalgo=FIPS186Random -Dorg.eclipse.jetty.util.log.class=org.eclipse.jetty.util.log.JavaUtilLog -Djava.util.logging.config.file={application.home}/lib/logging.properties -Dtika.config=tika-config.xml -Djava.locale.providers=COMPAT,SPI -Dsun.font.layoutengine=icu -Dcom.sun.media.jai.disableMediaLib=true -Dcoldfusion.datemask.useDasdayofmonth=true -Dcoldfusion.classPath={application.home}/lib/updates,{application.home}/lib/,{application.home}/gateway/lib/,{application.home}/wwwroot/WEB-INF/cfform/jars,{application.home}/bin/cf-osgicli.jar -javaagent:D:/FusionReactor/instance/cfusion.cf2021/fusionreactor.jar=name=cfusion.cf2021,address=8088 -agentpath:D:/FusionReactor/instance/cfusion.cf2021/frjvmti_x64.dll
    
    # Comma separated list of shared library path
    java.library.path={application.home}/lib,{application.home}/jintegra/bin,{application.home}/jintegra/bin/international
    
    # Comma separated list of shared library path for non-windows
    java.nixlibrary.path={application.home}/lib
    
    java.class.path=
    BKBK
    Community Expert
    Community Expert
    October 14, 2024

    @davecordes , thanks for the update on session and application scope, and for the JVM settings. The small file sizes tell us that application-scoped and session-scoped variables are unlikely to  the culprits.  


    Now looking into the JVM settings.

    Paolo Olocco
    Participating Frequently
    October 11, 2024

    Hi @davecordes , is possible to have prev and actual JVM parameters to compare it?

    Do you use CFTHREAD tag?

    Known Participant
    October 11, 2024

    Hi Paolo,


    I do have the previous and current JVM arguments to compare but those aren't very helpful since we are using the same parameters.


    Min Heap is the same on both servers.

    Max Heap is the same on both servers.


    We do not use CFTHREAD.

    BKBK
    Community Expert
    Community Expert
    October 12, 2024

    @davecordes , have you used Spotify's online thread dump analyzer yet? If so, what were the results?


    In case that didn't help, here is another thread dump tool, FastThread. It is free for limited use.

    BKBK
    Community Expert
    Community Expert
    October 10, 2024

    @davecordes ,

    Judging from the FusionReactor displays, it seems to me that none of the 5 things you mention is the root cause of the problem.

    Therefore, I would suggest that you return each of the 5 settings back to its original value.


    I think the cause of the issue is memory-intensive code. By this I mean code that increasingly uses memory, without any pause to free memory. Think, for example, of: 

    • excessive storage of objects in session, application, or server scope;
    • an infinite loop missing a cfbreak;
    • too many threads being created, and staying alive;
    • one or more collections of ever-increasing size;
    • excessive (that is, over-abundant, duplicate or unnecessary) caching;
    • excessive use of persistent CFCs;
    • large or frequent file downloads/uploads;
    • deadlock or circular dependencies (procees P1 waits for process P2 which waits for process P1 or procees P1 waits for process P2 which waits for process P3 which waits for Process P1). 


    Where to start looking for the offending code? FusionReactor's Memory (MB) and CPU (%) displays offer a clue. Notice how there is a Memory (MB) dip precisely at times when there is a CPU (%) peak. The times at which these occur are approximately 12:32:16, 12:32:29, 12:32:42, 12:32:48, 12:32:58, 12:33:10, 12:33:20.

    Now check FusionReactor's logs for the requests that were running at those times. Identify which of them were high-CPU. Those were the requests which actually attempted to reduce memory usage. Examine the corresponding code. Identify the processes which cost so much CPU to reduce so little memory.

    Known Participant
    October 10, 2024

    Hi BK,


    Thanks for your response. We did revert back to our original settings that we used on ColdFusion 2021 which were:


    Min Heap: 8192

    Max Heap: 8192

    GC Algorithm: ParallelGC

    Cached Templates: 1000

    Cached Queries: 5000


    1. I have checked Fusion Reactor's "Requests > Slow Requests" and "Requests  > Longest Requests" and nothing is over 30 seconds so I'm thiking we can cross off an infinite loop somewhere.


    2. I'm not sure how I would check for a collection of ever increasing size, but I don't think that is happening.


    3. We did identify a few downloads (Google Feeds) under "Requests > Requests By Memory" that were appearing at the top of that Fusion Reactor report that we moved to another server. Unfortunately, that didn't help.


    4. I don't see any deadlocks at the moment. If there were any, I would be getting error emails from the websites because we are using cferror and I am emailing myself.


    In that screenshot, you mentioned checking the logs for what was running when those dips in memory occurred, but I think what's happening here is that Java is attempting to garbage collect and that's the reason for the high CPU. I could be wrong, but that's how I read that image.


    Since both of our front end servers were close to crashing this morning, I took the liberty of changing the version of Java we're using. We are not using the official Oracle JDK on either one. We are now testing Amazon Coretto JDK on Server 1 and Microsoft's OpenJDK on Server 2. Will it help? Who knows. I am still searching for answers.


    Do you know how to decipher a heap dump? I've taken several snapshots but I have no idea how to look at this data.


    This is how both servers are looking roughly 5 hours after a ColdFusion restart.


    Charlie Arehart
    Community Expert
    Community Expert
    October 10, 2024

    Yes, indeed, it makes more sense that the cpu spikes would coincide with the major (mark sweep) Gc's, and frs graphs of each of those would confirm it. (Sadly, your original gc graphs were not for the same timeframe as the cpu graph, so we couldn't conclude for sure. But you can.)


    As I said in my response (the only one you've not yet replied to), it feels like something is increasingly holding on to memory that can't be Gc'ed. You'll want to find that. I gave you a couple of approaches.


    And I'll say now that heap dump analysis would often be more challenging than the other options I'd mentioned, but it certainly can be done and MAY help. But it's just a point in time.


    The fr memory profiler on the other hand can be triggered OVER time, like an hour after the instance has been started, and then a few hours later (in your case of slow, steady increase). Then it lets you compare the profiles to see what Java objects are increasing in size or count. Again, sometimes it's not clear what those objects equate to in cfml (same with a heap dump), but sometimes it may be clear.


    But again I'd suggest you check the sessions page. I know you told Paul you have 30-minute sessions. That could be the admin default, but code could override it. Worth at least looking. If that's not it, a strong candidate is something growing in one of your application scopes, or perhaps the server scope. Or use of cf caching, and so on.  A true "leak", like a cf bug is generally the least likely cause in my experience.


    Usually it's some aspect of code,  config, and/or load. And you may well have a difference in config between cf2021 and 2023 which has escaped notice.


    Finally, the jvm choice is also not likely at issue...though to be clear, Adobe only supports our using Oracle's jvm (which they license for our use). Using another seems a needless risk. But I'm just sharing perspective, not telling you what to do. 

    /Charlie (troubleshooter, carehart. org)
    Charlie Arehart
    Community Expert
    Community Expert
    October 9, 2024

    Dave, if you're thinking perhaps that the change to cf2023 is the cause of your problem, I'll say that I'm not aware of any known issue in cf2023 that's newly susceptible to increased memory usage.


    Yet it's not quite clear you have a memory "leak". The growth is steady over the course of a day, and you hit the limit (primarily in the old gen, which holds most of the heap). If you could increase the heap, that might buy you some time, but unless what's holding memory were to release it in 24 hours, it would indeed keep climbing.


    You do really need to find WHAT is holding onto memory which can't be gc'ed. (Changing gc algorithms is not the solution, as you found out.)


    Since you have fr, you could try to use its memory profiling feature. But it often proves hard to relate to the specific cf objects at issue. Still, it's worth a shot. See its docs or their videos on that.


    Instead, I'd recommend you focus on the nature of traffic you're getting. Paul referred to the possibility of unexpected traffic load, perhaps leading to an increase in sessions. Fr can help you see that. Look at the "uem&sessions" >sessions page.  Are they increasing at the same rate as memory itself, over that 24 hour period? If not, then it's something else.


    And some things to consider are NOT reflected in FR. It may be tough to assess things via such back and forth here. If we run out of steam, just know I can help directly--and often things become more clear in such a direct screenshare session that can't be communicated or anticipated here. More at carehart.org/consulting. 

    /Charlie (troubleshooter, carehart. org)
    Known Participant
    October 8, 2024

    This is what I was referring to in my original post regarding CPU spikes when the garabage collector is attempting to free memory.


    Legend
    October 8, 2024

    It could be session management issue?  Especially with the number of bots crawling sites these days.  For every bot that hits, CF will create a session.  If those sessions don't expire, they keep building up and taking memory.  We had this issues not too long ago.


    First, try reducing the length of time your seesions stay active.   You can do this in the Application.cfc file.  For instance, here would be a setting for a 20 minute session:


    <cfset THIS.sessiontimeout=CreateTimeSpan(0,0,20,0) />


     In addition, you can stop bot sessions altogether by testing to see if the session cookie exists, since bots don't use cookies.  Put this in your Application.cfc file.


    <cfif StructKeyExists(cookie, "cfid") or StructKeyExists(cookie, "jsessionid")>
    	<cfset THIS.sessiontimeout=CreateTimeSpan(0,0,20,0) />
    <cfelse>
    	<cfset this.sessiontimeout = CreateTimeSpan(0,0,0,3) />
    </cfif>


    Known Participant
    October 8, 2024

    Hi,


    Thanks for the suggestion. Our session timeout is currently set to 30 minutes so I don't think it is the cause of the problem, but I will try anything at this point.