Live View doesn't show JavaScript
Hi,
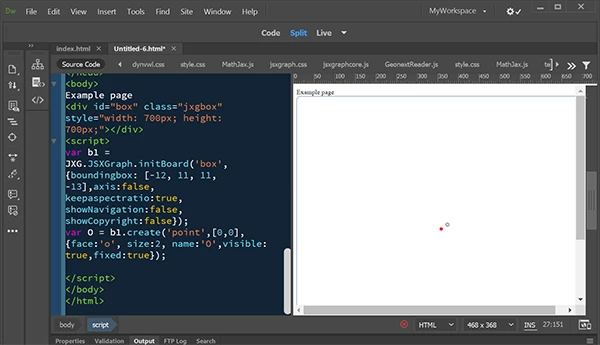
I encounter a problem using Dreamweaver CS 5.5, version 11.5 Build 5366. I know it’s not the latest one, but that’s what I have my license for. I used to program with the jsxgraph package and look at the result using “Live-Ansicht”(Live View, I suppose). In 2018 I had a break for roughly a year. Now I wanted to continue, but only see an empty box on the right, without the axes ect. I don’t know why? Can you please help me and tell what options or so I have to choose?
Best,
Christian Bauer
<!DOCTYPE html>
<html>
<head><title>Geldpolitische Maßnahmen im Mundell-Fleming Modell</title>
<meta http-equiv="Content-Type" content="text/html; charset=iso-8859-1" />
<meta name="generator" content="TeX4ht (http://www.tug.org/tex4ht/)" />
<meta name="originator" content="TeX4ht (http://www.tug.org/tex4ht/)" />
<!-- dynvwl,0,index=4,fn-in,next,frames,java,javascript,sections+,minitoc,html5,html,xhtml,mathml -->
<meta name="src" content="dynvwl.tex" />
<meta name="date" content="2019-02-07 15:38:00" />
<link rel="stylesheet" type="text/css" href="dynvwl.css" />
<meta http-equiv="Content-Type" content="text/html" charset="iso-8859-1" />
<link type="text/css" rel="stylesheet" media="all" href="http://dynamische-vwl.de/style.css" />
<script type="text/x-mathjax-config">MathJax.Hub.Config();</script>
<script type="text/javascript" src="http://jsxgraph.uni-bayreuth.de/distrib/MathJax/MathJax.js"></script>
<link rel="stylesheet" type="text/css" href="http://jsxgraph.uni-bayreuth.de/distrib/jsxgraph.css" />
<script charset="UTF-8" src='http://jsxgraph.uni-bayreuth.de/distrib/jsxgraphcore.js' type='text/javascript'></script>
<script src='http://jsxgraph.uni-bayreuth.de/distrib/GeonextReader.js' type='text/javascript'></script>
<link type="text/css" rel="stylesheet" href="protex/style.css" />
</head><body
>
<div id="box" class="jxgbox" style="width: 700px; height: 700px;"></div>
<script>
var b1 = JXG.JSXGraph.initBoard('box', {boundingbox: [-12, 11, 11, -13],axis:false, keepaspectratio:true, showNavigation:false, showCopyright:false});
var O = b1.create('point',[0,0],{face:'o', size:2, name:'O',visible: true,fixed:true});
</script>
</body>
</html>