
Participant
Feb 6, 2020 7:21 PM UTC
Question

Debugger fails to load in the latest Chrome

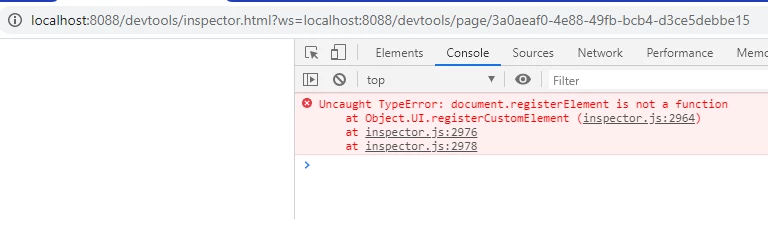
I noticed this issue yesterday when triying to debug an html extension. When launching the debuger (in my case localhost:8088), you'll see the initial page w/ 'Inspectable WebContent' title and the link to your extension, but when you click on the link the browser loads only an empty page (see below). Before yesterday opening a debugger wasn't a problem. The only change I see is Chrome was updated (80.0.3987.87). It doesn't matter what host app you're using for your extension, the debugger has the same problem.

Is this a known issue?
 

    This topic is closed to new replies. Start a new post to keep the conversation going.

    3 replies

    Karmalakas
    Known Participant
    Mar 9, 2020 5:28 PM UTC

    Same here. Few days ago added CEP 9.x Sanple extension, changed registry and had same JS errors.

    Here's what I get with panel open in Ps:


    And here's, when I click on index.html:


    Latest Win 10 x64

    Latest Chrome

    Latest Ps CC

    Translate
    Inspiring
    Aug 5, 2020 8:53 AM UTC

    I try to get remote debugging working for my extension, The Inspectable WebContents page loads, onces clicked, a blank page.

    I'm new to the chrome dev tools, but all instructions I found, I should see these dev tools when the link is clicked on... right?

    On another PC, for some reason, it won't even find "http://localhost:8088/" on the same extension.

    Adobe, any updates on how we can debug JSX from an PS extension at this moment?

    The only way I can notice something is wrong is when the UI font changes of the extension, and JSX silently errors.

    Translate
    Participant
    Feb 13, 2020 7:34 AM UTC

    Having the same problem since yesterday. Really annoying since there is no other way to watch what happens in the app besides alerts 😞 

    Translate