Multiple Vertical Axis Renderers and auto scaling
Hi
I have a problem which has been kicking my rear end for a while now.
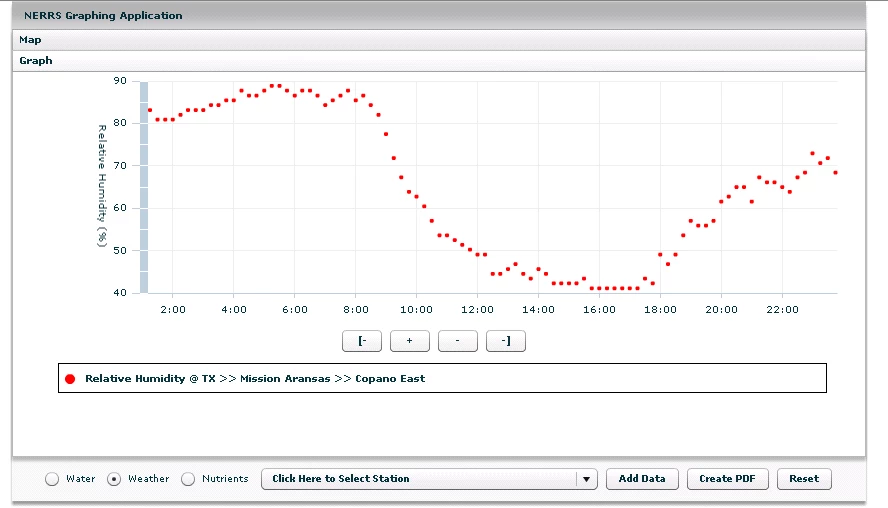
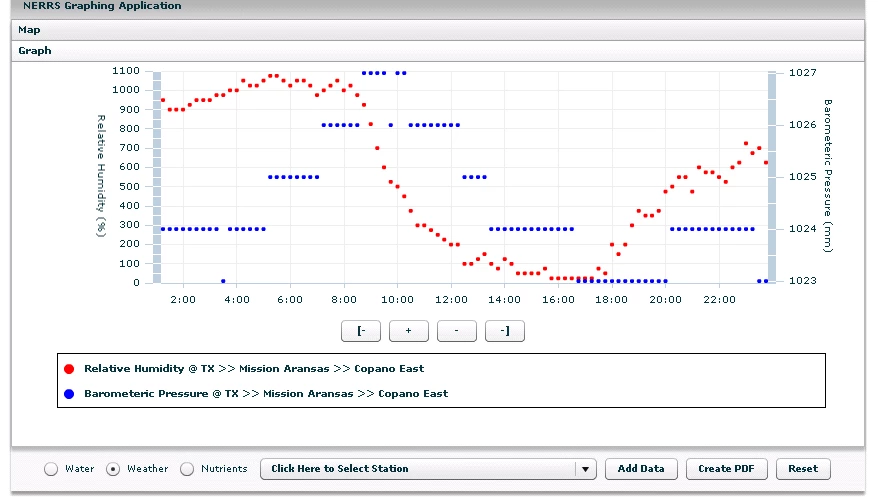
I have a Linechart to which I add (programmatically in AS code) multiple PlotSeries. I let the first series be handled by the default verticalaxisrenderer (on the left side of the graph) and then the next series (if a different type of data) be rendererd by another verticalAxisrenderer (created programmtically) and added to the right side. And it "works", but the problem is this:
Say I add a series that has a range of 30-80 first. It works fine, BUT when i add a second series with a range of say 1100-1200 the second series is added fine but the first series is 'rescaled' on the axis to go from 30-80 to 0-1200! Which is obviously wrong! I have made other attempts to fix this and it always rescales the axis (sometimes rescaling the data, sometimes not) I have double checked that baseatZero is false and it is--its just the act of adding that second series which causes this redraw and rescale. What am I missing here? Atatched is code snippet and screenshots of behavior.
On Flex 3.5, btw
public function addSeriesToChart(acLocal:ArrayCollection, constellation:String, station:String, param:String):void
{
var currentSeries:Array = lcGraph1.series;
var stati:int = util.getStationName(station,currentStations);
var stat:String = currentStationsLong[stati];
var s:Object;
var ls:PlotSeries = new PlotSeries();
ls.displayName = y1_axis + " @ "+stat;
ls.yField = "y1";
ls.xField = "x1";
ls.dataProvider = acLocal;
seriesmin(acLocal);
var stroke:Stroke = util.getLineStroke2(nSeries);
ls.setStyle("stroke", stroke);
ls.setStyle("fill",stroke.color);
ls.setStyle("radius", 2);
ls.setStyle("itemRenderer",new ClassFactory(CircleItemRenderer));
s = ls;
var renderers:Array=lcGraph1.verticalAxisRenderers;
Application.application.export.enabled = true;
//two cases: first series and 2+ series: must handle the default verticalAxisRenderer bug
if (nSeries > 0)
{
//if second series == first series, dont add a new renderer
if (param != currentGraphParam(acParam1))
{
var la2:LinearAxis = new LinearAxis();
la2.displayName = y1_axis+" ("+util.getUnits(util.EnglishNametoCBIBSParam(param))+")";
la2.title = y1_axis+" ("+util.getUnits(util.EnglishNametoCBIBSParam(param))+")";
la2.baseAtZero = false;
// la2.maximum = seriesmax(acLocal)+1;
// la2.minimum = seriesmin(acLocal)-1;
// lcGraph1.verticalAxisRenderer[0].axis.maximum = cMax;
// lcGraph1.verticalAxisRenderer[0].axis.minimum= cMin;
ar2=new AxisRenderer();
ar2.axis=la2;
if ((nSeries % 2) == 1)
{
ar2.placement="right"
}
else
{
ar2.placement="left";
}
renderers.push(ar2);
s.verticalAxis = la2;
lcGraph1.verticalAxisRenderers=renderers;
}
currentSeries.push(s);
lcGraph1.verticalAxisRenderers=renderers;
lcGraph1.invalidateSeriesStyles();
lcGraph1.series = currentSeries;
}
else
{
//create new axis
var la2:LinearAxis = new LinearAxis();
la2.displayName = y1_axis+" ("+util.getUnits(util.EnglishNametoCBIBSParam(param))+")";
la2.title = y1_axis+" ("+util.getUnits(util.EnglishNametoCBIBSParam(param))+")";
la2.baseAtZero = false;
ar2=new AxisRenderer();
//dont show it
ar2.visible = false;
ar2.placement = "left";
la2.maximum = seriesmax(acLocal)+1;
la2.minimum = seriesmin(acLocal)-1;
cMax = la2.maximum;
cMin = la2.minimum;
// Alert.show(cMax);
// Alert.show(cMin);
ar2.axis=la2;
renderers.push(ar2);
s.verticalAxis = la2;
currentSeries.push(s);
lcGraph1.series = currentSeries;
lcGraph1.verticalAxisRenderers=renderers;
lcGraph1.invalidateSeriesStyles();
lcGraph1.verticalAxis.title = y1_axis+" ("+util.getUnits(util.EnglishNametoCBIBSParam(param))+")";
disableDefaultVerticalRenderer();
}
Application.application.arrAc.push(acLocal);
nSeries++;
}