


Copy link to clipboard
Copied
Hi, I am new to Actionscript 3. I have been learning how to code in AS3 on the go from forums on the net and from Youtube videos, so if anything I've said in this post is inappropriate as far as coding in AS3 is concerned, I apologize for the same. I am trying to create a graph as shown in the image with the inputs on the X-axis and the result on the Y-axis. I have also attached a screenshot of the inputs and resulting outputs. I have coded most of it, but I cannot figure out how to actually plot the graph corresponding to the input and resulting output values. I also want to improve the code given below for the "x" and "y" position of the text boxes (xtBox and ytBox, respectively), the horizontal and vertical markers (hLine and vLine respectively), and the "x" and "y" text labels (xLabel and yLabel, respectively). "x" and "y" arrays have to be sorted in ascending order, the maximum value has to be divided by the length of the array to display the numerical text on the axis with even distribution (as we used to do while taking units for plotting of graphs in math class in school). It would also be great if someone could tell me how to shrink the code, if at all it can be reduced (I have done the best I could using arrays). I use Adobe Flash CS6 on a Windows 7 32-bit machine.
Calculating the result
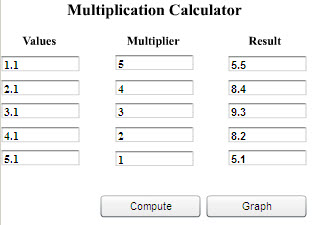
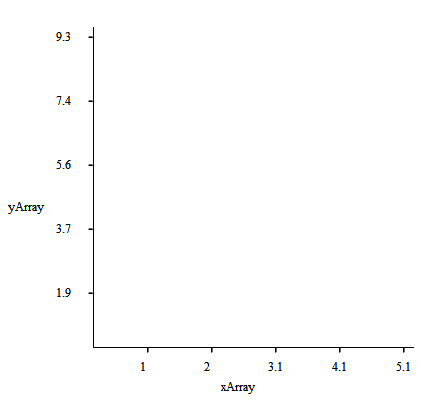
Graph
The code is given below:
//Creating the graph
graph.addEventListener(MouseEvent.CLICK, graphBtn);
function graphBtn(event:MouseEvent):void
{
gotoAndStop(2);
var spBoard:Sprite = new Sprite();
addChild(spBoard);
spBoard.x = 0;
spBoard.y = 0;
var nSize:Number = 320;
//var nPoints:Number = 320;
var shAxes:Shape = new Shape();
spBoard.addChild(shAxes);
drawAxes();
function drawAxes():void
{
shAxes.graphics.clear();
shAxes.graphics.lineStyle(1,0x000000);
//Draw y-axis
shAxes.graphics.moveTo(0,0);
shAxes.graphics.lineTo(0,nSize);
//Draw x-axis
shAxes.graphics.moveTo(0,nSize);
shAxes.graphics.lineTo(nSize,nSize);
}
//Input on X-axis//
var xXPos = spBoard.x+44;
var xYPos = spBoard.y+nSize+10;
var vxXPos = spBoard.x+54;
var vyYPos = spBoard.y+nSize+3;
var inputArray:Array = [];
for (i=0; i<textInputs.length; i++)
{
inputArray.push(Number(textInputs.text));
}
inputArray.sort(Array.NUMERIC);
var xlastValue = inputArray[4]/inputArray.length;
trace (xlastValue);
var xtempArray:Array = [Math.round((xlastValue)*10)/10,Math.round((xlastValue*2)*10)/10,Math.round((xlastValue*3)*10)/10,Math.round((xlastValue*4)*10)/10,Math.round((xlastValue*5)*10)/10];
trace (xtempArray);
for (i=0; i<inputArray.length; i++)
{
var xArray:Array = xtempArray;
var xtBox = new (TextField);
xtBox.text = String(xArray);
spBoard.addChild(xtBox);
xtBox.x = xXPos;
xXPos+=64;
xtBox.y = xYPos;
var vLine = new (VLine);
spBoard.addChild(vLine);
vLine.x = vxXPos;
vxXPos+=64;
vLine.y = vyYPos;
}
var xLabel = new (TextField);
xLabel.text = String("xArray");
spBoard.addChild(xLabel);
xLabel.x = 125;
xLabel.y = nSize+30;
trace("X Array: "+xArray);
//Result on Y-axis//
var yXPos = spBoard.x-40;
var yYPos = spBoard.y;
var hxXPos = spBoard.x-3;
var hyYPos = spBoard.y+10;
var resultArray:Array = [];
for (i=0; i<textOutputs.length; i++)
{
resultArray.push(Number(textOutputs.text));
}
resultArray.sort(Array.NUMERIC);
var ylastValue = resultArray[4]/resultArray.length;
trace (ylastValue);
var ytempArray:Array = [Math.round(ylastValue*10)/10,Math.round((ylastValue*2)*10)/10,Math.round((ylastValue*3)*10)/10,Math.round((ylastValue*4)*10)/10,Math.round((ylastValue*5)*10)/10];
trace (ytempArray);
ytempArray.reverse();
for (i=0; i<resultArray.length; i++)
{
var yArray:Array = ytempArray;
var ytBox = new (TextField);
ytBox.text = String(yArray);
spBoard.addChild(ytBox);
ytBox.x = yXPos;
ytBox.y = yYPos;
yYPos+=64;
var hLine = new (HLine);
spBoard.addChild(hLine);
hLine.x = hxXPos;
hLine.y = hyYPos;
hyYPos+=64;
}
var yLabel = new (TextField);
yLabel.text = String("yArray");
spBoard.addChild(yLabel);
yLabel.x = -88;
yLabel.y = 170;
trace("Y Array: "+yArray);
}


 1 Correct answer

Hi.
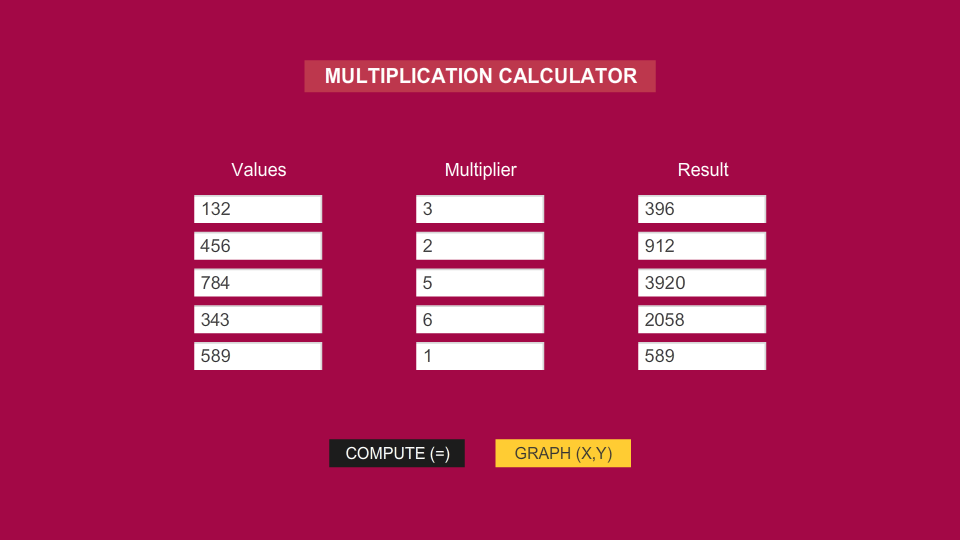
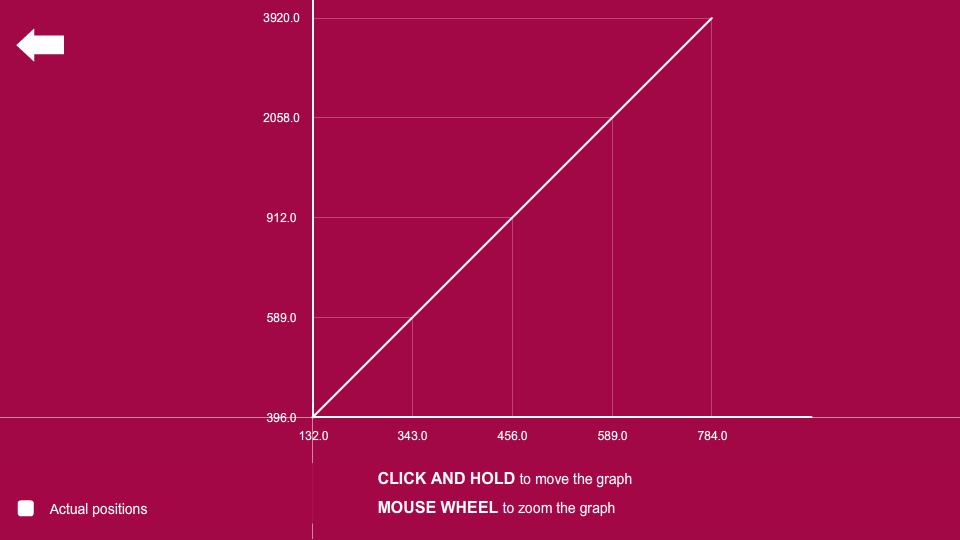
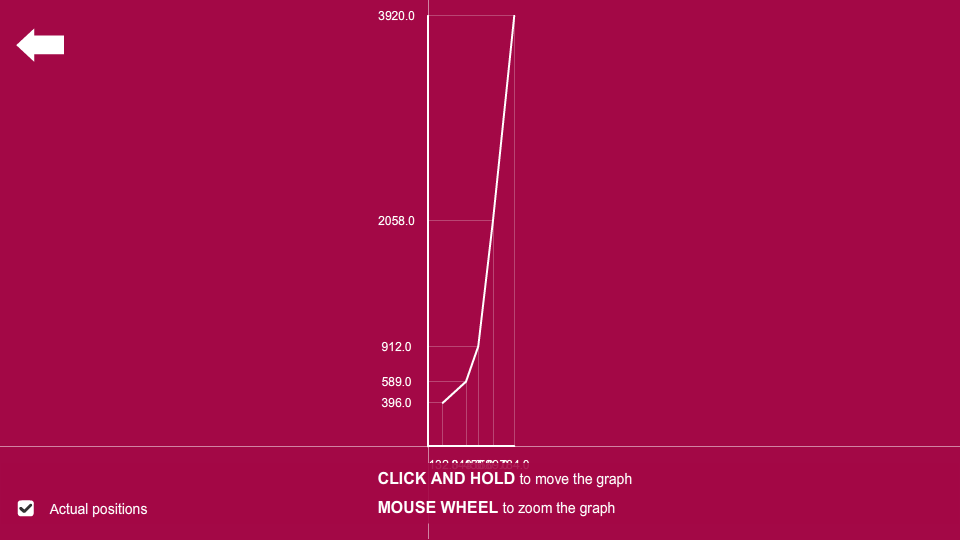
I have a working sample here. Please notice that you can move and zoom the graph.
I just cannot promise a small code and possibly this example will not solve all of your problems.
My goal here is only to get you started.
Preview:
AS3 code:
[FRAME 1 / Calculator]
...import flash.events.MouseEvent;
import flash.text.TextField;
import flash.display.MovieClip;
var actualPositions:Boolean = false;
var fixedOffset:Number = 100;
var markerSize:uint = 10;
var graphScale:Number = 1;
var minZoom:Number = 0.01;
var zoom
 14
Replies
14
14
Replies
14

Copy link to clipboard
Copied
One option for dealing with the graphing is to make use of a movieclip object for the graph such that its 0,0 origin is placed at a convenient location - namely the lower left corner of what you show. That way you can plant points/lines on the graph relative to a 0,0 origin and whatever scaling of values is needed to represent the values the graph covers. For instance, your positioning of 1 on the x-axis looks to be about 100 pixels from the origin, so the position of a point representing xArray = 1 would be .x=100 (or 100 times the value of xArray)
Edit: For the above described scenario you will need to negate the y axis values since in Flash the y values increase as you move downwards.
Copy link to clipboard
Copied
Thanks for your reply. I did think of creating a new movieclip for graphing. However, I could not figure out how to pass the input and resulting values (which are stored as arrays) from the movieclip where the calculation is done to a movieclip which will implement graphing. Can you guide me with some code that will allow me to pass the values of these arrays?
Copy link to clipboard
Copied
What could be done, assuming you are using timeline-based coding, is to have all of your code in the main timeline, or at least the arrays you are filling. Then the children can all share access to the data from a similar vantage point. If you put all the code in the main timeline you start using the movieclips more literally as display objects, where the main timeline code dictates what each displays. You just modify the code to be targeting the movieclips for the various textfields you create and data you fill them with.
Copy link to clipboard
Copied
Hi.
I have a working sample here. Please notice that you can move and zoom the graph.
I just cannot promise a small code and possibly this example will not solve all of your problems.
My goal here is only to get you started.
Preview:


AS3 code:
[FRAME 1 / Calculator]
import flash.events.MouseEvent;
import flash.text.TextField;
import flash.display.MovieClip;
var actualPositions:Boolean = false;
var fixedOffset:Number = 100;
var markerSize:uint = 10;
var graphScale:Number = 1;
var minZoom:Number = 0.01;
var zoomIncrement:Number = 0.05;
var multiplicandsList:Vector.<Number> = new Vector.<Number>();
var resultsList:Vector.<Number> = new Vector.<Number>();
function multiply(e:MouseEvent):void
{
multiplicandsList.splice(0, multiplicandsList.length);
resultsList.splice(0, resultsList.length);
for (var i:int = results.numChildren - 1; i >= 0; i--)
{
var multiplicand:Number = Number((multiplicands.getChildAt(i) as MovieClip).txt.text);
var multiplier:Number = Number((multipliers.getChildAt(i) as MovieClip).txt.text);
var result:Number;
var resultText:TextField;
if (isNaN(multiplicand) || isNaN(multiplier))
return;
resultText = (results.getChildAt(i) as MovieClip).txt;
result = multiplicand * multiplier;
resultText.text = String(result);
multiplicandsList.push(multiplicand);
resultsList.push(result);
graphButton.alpha = 1;
graphButton.mouseEnabled = true;
}
}
function generateGraph(e:MouseEvent):void
{
if (multiplicandsList.length == 0 || resultsList.length == 0)
return;
gotoAndStop(2);
}
function setCalculator():void
{
stop();
graphButton.alpha = 0.25;
graphButton.mouseEnabled = false;
computeButton.addEventListener(MouseEvent.CLICK, multiply);
graphButton.addEventListener(MouseEvent.CLICK, generateGraph);
}
setCalculator();
[FRAME 2 / Graph]
import flash.display.Sprite;
import flash.display.DisplayObject;
import flash.events.MouseEvent;
import flash.text.TextFieldAutoSize;
import flash.geom.Rectangle;
var graph:Sprite;
var xValues:Vector.<Number>;
var yValues:Vector.<Number>;
var styles:Object =
{
strong:
{
tickness:2,
color:0xFFFFFF,
alpha:1
},
regular:
{
tickness:0.1,
color:0xFFFFFF,
alpha:0.5
},
thin:
{
tickness:0.25,
color:0xFFFFFF,
alpha:0.25
}
};
function goBack(e:MouseEvent):void
{
if (graph.stage)
{
removeChild(graph);
graph = null;
stage.removeEventListener(MouseEvent.MOUSE_DOWN, moveGraph);
stage.removeEventListener(MouseEvent.MOUSE_UP, releaseGraph);
stage.removeEventListener(MouseEvent.MOUSE_WHEEL, drawGraphic);
}
gotoAndStop(1);
}
function setGraph():void
{
xValues = multiplicandsList.sort(Array.NUMERIC);
yValues = resultsList.sort(Array.NUMERIC);
graph = new Sprite();
graph.x = stage.stageWidth * 0.5;
graph.y = stage.stageHeight * 0.5;
addChildAt(graph, 0);
drawGraphic(null);
graphUI.checkButton.icon.visible = actualPositions;
graphUI.checkButton.addEventListener(MouseEvent.CLICK, checkHandler);
backButton.addEventListener(MouseEvent.CLICK, goBack);
stage.addEventListener(MouseEvent.MOUSE_DOWN, moveGraph);
stage.addEventListener(MouseEvent.MOUSE_UP, releaseGraph);
stage.addEventListener(MouseEvent.MOUSE_WHEEL, drawGraphic);
}
function checkHandler(e:MouseEvent):void
{
actualPositions = !actualPositions;
e.currentTarget.icon.visible = actualPositions;
drawGraphic(null);
}
function moveGraph(e:MouseEvent):void
{
graph.startDrag(false, new Rectangle(0, 0, stage.stageWidth, stage.stageHeight));
}
function releaseGraph(e:MouseEvent):void
{
stopDrag();
}
function drawGraphic(e:MouseEvent):void
{
var tempXValues:Vector.<Number> = new Vector.<Number>();
var tempYValues:Vector.<Number> = new Vector.<Number>();
var resultPositions:Array = [];
var textFieldsX:Vector.<OutputValue> = new Vector.<OutputValue>();
var textFieldsY:Vector.<OutputValue> = new Vector.<OutputValue>();
var scaledOffset:Number = fixedOffset * graphScale;
var i:uint
var total:uint;
graph.graphics.clear();
while (graph.numChildren > 0)
graph.removeChildAt(0);
if (e)
{
graphScale += (e.delta / 3) * zoomIncrement;
graphScale = Math.max(minZoom, graphScale);
}
tempXValues = tempXValues.concat(xValues);
tempYValues = tempYValues.concat(yValues);
tempXValues.forEach(function(element:*, index:int, vec:Vector.<Number>):void
{
tempXValues[index] *= graphScale;
});
tempYValues.forEach(function(element:*, index:int, vec:Vector.<Number>):void
{
tempYValues[index] *= graphScale;
});
graph.graphics.lineStyle(styles.regular.tickness, styles.regular.color, styles.regular.alpha);
graph.graphics.moveTo(-stage.stageWidth, 0);
graph.graphics.lineTo(stage.stageWidth, 0);
graph.graphics.moveTo(0, -stage.stageHeight);
graph.graphics.lineTo(0, stage.stageHeight);
graph.graphics.lineStyle(styles.strong.tickness, styles.strong.color, styles.strong.alpha);
graph.graphics.moveTo(0, 0);
graph.graphics.lineTo(actualPositions ? tempXValues[0] : scaledOffset * tempXValues.length, 0);
graph.graphics.moveTo(0, 0);
graph.graphics.lineTo(actualPositions ? tempXValues[tempXValues.length - 1] : scaledOffset * tempXValues.length, 0);
graph.graphics.moveTo(0, 0);
graph.graphics.lineTo(0, -(actualPositions ? tempYValues[0] : scaledOffset * tempYValues.length));
graph.graphics.moveTo(0, 0);
graph.graphics.lineTo(0, -(actualPositions ? tempYValues[tempYValues.length - 1] : scaledOffset * tempYValues.length));
graph.graphics.lineStyle(styles.thin.tickness, styles.thin.color, styles.thin.alpha);
resultPositions[0] = [];
resultPositions[1] = [];
for (i = 0, total = tempXValues.length; i < total; i++)
{
resultPositions[0] =
{
x0:actualPositions ? tempXValues : scaledOffset * i,
y0:0,
x1:actualPositions ? tempXValues : scaledOffset * i,
y1:actualPositions ? -tempYValues : -scaledOffset * i
};
graph.graphics.moveTo(resultPositions[0].x0, resultPositions[0].y0);
graph.graphics.lineTo(resultPositions[0].x1, resultPositions[0].y1);
textFieldsX.unshift(new OutputValue());
textFieldsX[0].x = actualPositions ? tempXValues : scaledOffset * i;
textFieldsX[0].y = markerSize + textFieldsX[0].height * 0.5;
textFieldsX[0].txt.autoSize = TextFieldAutoSize.CENTER;
textFieldsX[0].txt.text = String((tempXValues / graphScale).toFixed(1));
graph.addChild(textFieldsX[0]);
}
for (i = 0, total = tempYValues.length; i < total; i++)
{
resultPositions[1] =
{
x0:0,
y0:actualPositions ? -tempYValues : -scaledOffset * i,
x1:actualPositions ? tempXValues : scaledOffset * i,
y1:actualPositions ? -tempYValues : -scaledOffset * i
};
graph.graphics.moveTo(resultPositions[1].x0, resultPositions[1].y0);
graph.graphics.lineTo(resultPositions[1].x1, resultPositions[1].y1);
textFieldsY.unshift(new OutputValue());
textFieldsY[0].x = -markerSize - textFieldsY[0].width * 0.5;
textFieldsY[0].y = actualPositions ? -tempYValues : -scaledOffset * i;
textFieldsY[0].txt.autoSize = TextFieldAutoSize.CENTER;
textFieldsY[0].txt.text = String((tempYValues / graphScale).toFixed(1));
graph.addChild(textFieldsY[0]);
}
for (i = 0, total = resultPositions[1].length; i < total; i++)
{
graph.graphics.lineStyle(styles.strong.tickness, styles.strong.color, styles.strong.alpha);
if (i < resultPositions[1].length - 1)
{
graph.graphics.moveTo(resultPositions[1].x1, resultPositions[1].y1);
graph.graphics.lineTo(resultPositions[1][i + 1].x1, resultPositions[1][i + 1].y1);
}
}
}
setGraph();
FLA download:
animate_cc_as3_text_inputs_to_graph.zip - Google Drive
I hope this helps.
Regards,
JC
Copy link to clipboard
Copied
Thank you very much for your help. I will refer to your work and see how i can apply it to my code and will get back to you as to how i progress or if i have any further questions.
Copy link to clipboard
Copied
You're welcome!
Please don't hesitate to ask if you have any questions.
Regards,
JC
Copy link to clipboard
Copied
I do not need to scale or zoom the graph. I did not understand how the drawgraphic function works. Can i achieve what im trying to do with just arrays or do i have to use vectors (still trying to figure out how a vector and its syntax works). All im trying to do is plot the graph for corresponding values of input and result and a dot along with a label is displayed on the graph showing the value that is plotted. At the same time, the input values and results are scaled in a manner which we used to do in school (for eg 2cms = 1unit). Hope this makes sense.
Copy link to clipboard
Copied
Here is the link to what I've done so far. By the way, I used some FLA files from the Mathematical Association of America's website as a guide to reach the stage at I am now.
https://drive.google.com/open?id=16r4MpHVYixHYU9e3KwdG3JIZHU050IoG
Copy link to clipboard
Copied
Hi.
I updated the link and included a simplified version. I hope it can help you understand better now.
About vectors, you can just replace them with arrays. The usage is practically the same. The advantage of using vectors is performance, type safety, and reliablity.
Vector - Adobe ActionScript® 3 (AS3 ) API Reference
Regards,
JC
Copy link to clipboard
Copied
Thank you for your help. I have a question. What if i were to use the flex sdk to achieve the same result? I downloaded the flex sdk and was able to successfully import the libraries in Flash cs6. I know people generally use Flash Builder or Flash Develop or a similar IDE. I am not at all an experienced coder as most coders are and am not that good at it either but I do like coding and find it interesting. So, i was wondering if the same kind of graph could be generated using the Flex SDK from within Flash cs6 with timeline based navigation. I entered the following code and i got an error "cannot access null object reference" or something like that (i forget what it was exactly) when i used the following code:
var lc:LineChart = new LineChart();
I am not asking you to give me a whole file as you have already helped me out a lot. I just want to know what Im doing wrong as far as the above code is concerned and how i should proceed. Much of what has been done with this project can be easily achieved with software like Excel but i decided to use Flash as its a different way of approaching this project with the multiplication calculator. Once this calculator works properly by me the same approach can be applied to other projects.

Copy link to clipboard
Copied
hi sir can you resending the fla file above corrcetly

Copy link to clipboard
Copied
Copy link to clipboard
Copied


Copy link to clipboard
Copied


 AdChoices