

- Home
- ColdFusion
- Discussions
- Re: Coldfusion 2016 JVM issues, CPU spikes
- Re: Coldfusion 2016 JVM issues, CPU spikes

Copy link to clipboard
Copied
Upgraded to CF 2016 (on Windows 2016 64 bit VM server with 2 CPUs and 4GB of ram), and have had a lot of issues with the server hanging, going very slow, and the CPU spiking to very close to 100% and never going down. Usually a server/CF service restart fixes the issue for a while. I'm rebooting the server sometimes 3-4 times a day. This is the same code that worked fine w/o any issues like this in the past for years. After a reboot things will look like normal for hours, and then just slowly deteriorate to the point where it's unusable. It's kind of random too. Sometimes 2-3 hours. Sometimes 6, etc. Sometimes it'll happen overnight when just a few scheduled tasks are running. Things that have run for years w/o issue.
I'm trying to tweak the java arguments to help resolve this thinking this is maybe the problem. This is my jvm.config arguments:
java.args=-server -Xms1024m -Xmx1024m -XX:+PrintGCDetails -XX:+PrintGCTimeStamps -XX:+PrintHeapAtGC -verbose:gc -Xloggc:web_GC.log -Xdebug -Xrunjdwp:transport=dt_socket,server=y,suspend=n,address=5005 -XX:MaxMetaspaceSize=192m -XX:+UseParallelGC -Xbatch -Dcoldfusion.home={application.home} -Duser.language=en -Dcoldfusion.rootDir={application.home} -Dcoldfusion.libPath={application.home}/lib -Dorg.apache.coyote.USE_CUSTOM_STATUS_MSG_IN_HEADER=true -Dcoldfusion.jsafe.defaultalgo=FIPS186Random -Dorg.eclipse.jetty.util.log.class=org.eclipse.jetty.util.log.JavaUtilLog -Djava.util.logging.config.file={application.home}/lib/logging.properties -Dcoldfusion.classPath={application.home}/lib/updates,{application.home}/lib,{application.home}/lib/axis2,{application.home}/gateway/lib/,{application.home}/wwwroot/WEB-INF/flex/jars,{application.home}/wwwroot/WEB-INF/cfform/jars
I've also updated java to jre1.8.0_131 and use that for Coldfusion.
I monitor the garbage collection in GCViewier. Here is a screenshot around when one of the hangups occur. The black lines are "Full GC lines".
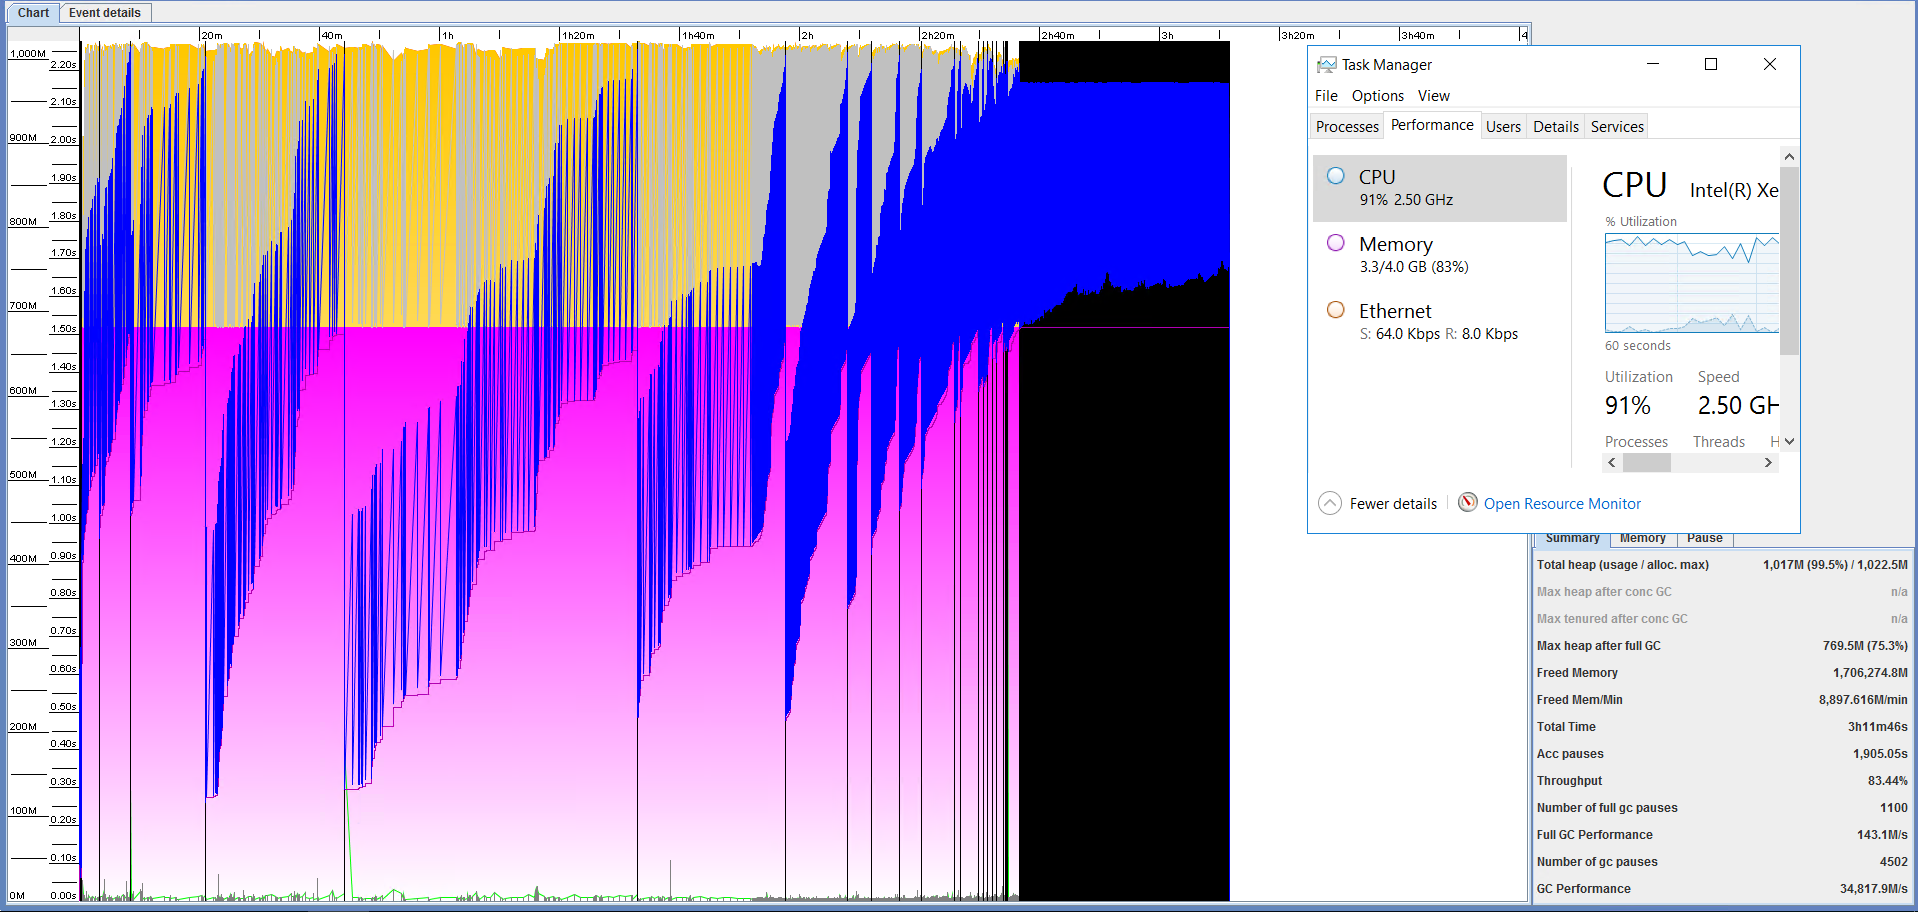
I've also done a few thread dumps and notice the ParOldGen is always maxed out around 99% when the issue occurs. I didn't see anything too obvious in the thread dump otherwise. Could post more if needed.
Heap
PSYoungGen total 334336K, used 28807K [0x00000000eab00000, 0x0000000100000000, 0x0000000100000000)
eden space 319488K, 9% used [0x00000000eab00000,0x00000000eca02ab0,0x00000000fe300000)
from space 14848K, 0% used [0x00000000fe300000,0x00000000fe300000,0x00000000ff180000)
to space 14848K, 0% used [0x00000000ff180000,0x00000000ff180000,0x0000000100000000)
ParOldGen total 699392K, used 699181K [0x00000000c0000000, 0x00000000eab00000, 0x00000000eab00000)
object space 699392K, 99% used [0x00000000c0000000,0x00000000eaacb560,0x00000000eab00000)
Metaspace used 142208K, capacity 164916K, committed 165196K, reserved 1191936K
class space used 16865K, capacity 22202K, committed 22348K, reserved 1048576K
I also installed a trial version of Seefusion just to see if anything obvious is hanging or running slow. Nothing really came up either. Right after a CF restart pages take slightly longer while things get cached, but then it looks good. We have a few different instances of CFWheels running on our site. I'm sure there's a little extra overhead there, but nothing that CF couldn't handle in the past.
I've read some information on different flags (Java HotSpot VM Options ) or swapping out "UseParallelGC" for a different type of garbage collection. Most of the Coldfusion information is from years ago. Just not sure what applies anymore, or what else could be causing this.
I checked the thread dump for any java outofmemoryerror's in the log, but don't see any. Based on some more reading, I'm thinking maybe I should try to add a -XX:Permsize= or -XX:maxpermsize= to my arguments possibly.
Any help or insight would be greatly appreciated!


 1 Correct answer

mike42780 wrote
Upgraded to CF 2016 (on Windows 2016 64 bit VM server with 2 CPUs and 4GB of ram),
Trying to run a server OS in 4GB or RAM is asking for problems.
Review the ColdFusion minimum requirements, although you will be much better off with the recommended requirements.
Cheers
Eddie
 12
Replies
12
12
Replies
12
Copy link to clipboard
Copied
mike42780 wrote
Upgraded to CF 2016 (on Windows 2016 64 bit VM server with 2 CPUs and 4GB of ram),
Trying to run a server OS in 4GB or RAM is asking for problems.
Review the ColdFusion minimum requirements, although you will be much better off with the recommended requirements.
Cheers
Eddie
Copy link to clipboard
Copied
Interesting. We've never had a problem in the past with 4GB so I didn't really even think about it. And everything runs fine for hours, and in the past days, so I can't help but wonder if there's some more configuration I could be doing as well. I can probably upgrade to 8GB of ram to start on the hardware side though.
And then I would be upping java.args=-server -Xms1024m -Xmx1024m to 2 or 3GB then I'm assuming as well to take advantage of the increased ram.
Copy link to clipboard
Copied
Yes, you will need to adjust the JAVA settings to take advantage of the extra memory.
I'm not saying that this will resolve your issue. It might be that the problem process will consume however much memory you throw at it.
Cheers
Eddie
Copy link to clipboard
Copied
Upgraded the server to 8GB of ram. Changed Coldfusion to -Xms2048m -Xmx2048m. Unfortunately probably won't have a true test of the server load until Monday.

Copy link to clipboard
Copied
Mike said:
>I checked the thread dump for any java outofmemoryerror's in the log, but don't see any. Based on some more reading, I'm thinking maybe I should try to add a -XX:Permsize= or -XX:maxpermsize= to my arguments possibly.
Those Permsize parameters are for Java 7. You are using Java 8 (version 8u131) so defining Permsize will be syntax error. The similar parameters would be MetaspaceSize= EG -XX:MetaspaceSize=312m -XX:MaxMetaspaceSize=640m
Eddie commented
>I'm not saying that this will resolve your issue. It might be that the problem process will consume however much memory you throw at it.
That's what I have observed for CF2016 update 4 on Windows 2016.
Regards, Carl.
Copy link to clipboard
Copied
Thanks for the responses. The server seems to be performing much better with the increased ram. I don't know why I didn't think of looking at that first. I guess because it had worked fine in the past with 4GB of ram. Either way, I'll wait maybe a few more days and then mark the response as correct if I don't see any other issues.
Copy link to clipboard
Copied
Hi Mike,
Suggest periodically look at your web_GC.log file for ParOldGen size to know how that is being consumed as usage is occurring.
Regards, Carl.
Copy link to clipboard
Copied
Thanks Carl, good info. I just went through the current logs and noticed the ParOldGen size starts at the min, increases to the max, and then does a full Garbage collection. And then starts over. Does that over and over. Seem to be working more as expected. Response time on the website seems to be much better too.
Copy link to clipboard
Copied
Visually, am I looking at the blue lines that go up and fall back down to see that it's garbage collecting? The blue lines being the used heap on GCviewer? i can't seem to find paroldgen on gcviewer, but see it in the log file no problem. Thanks again.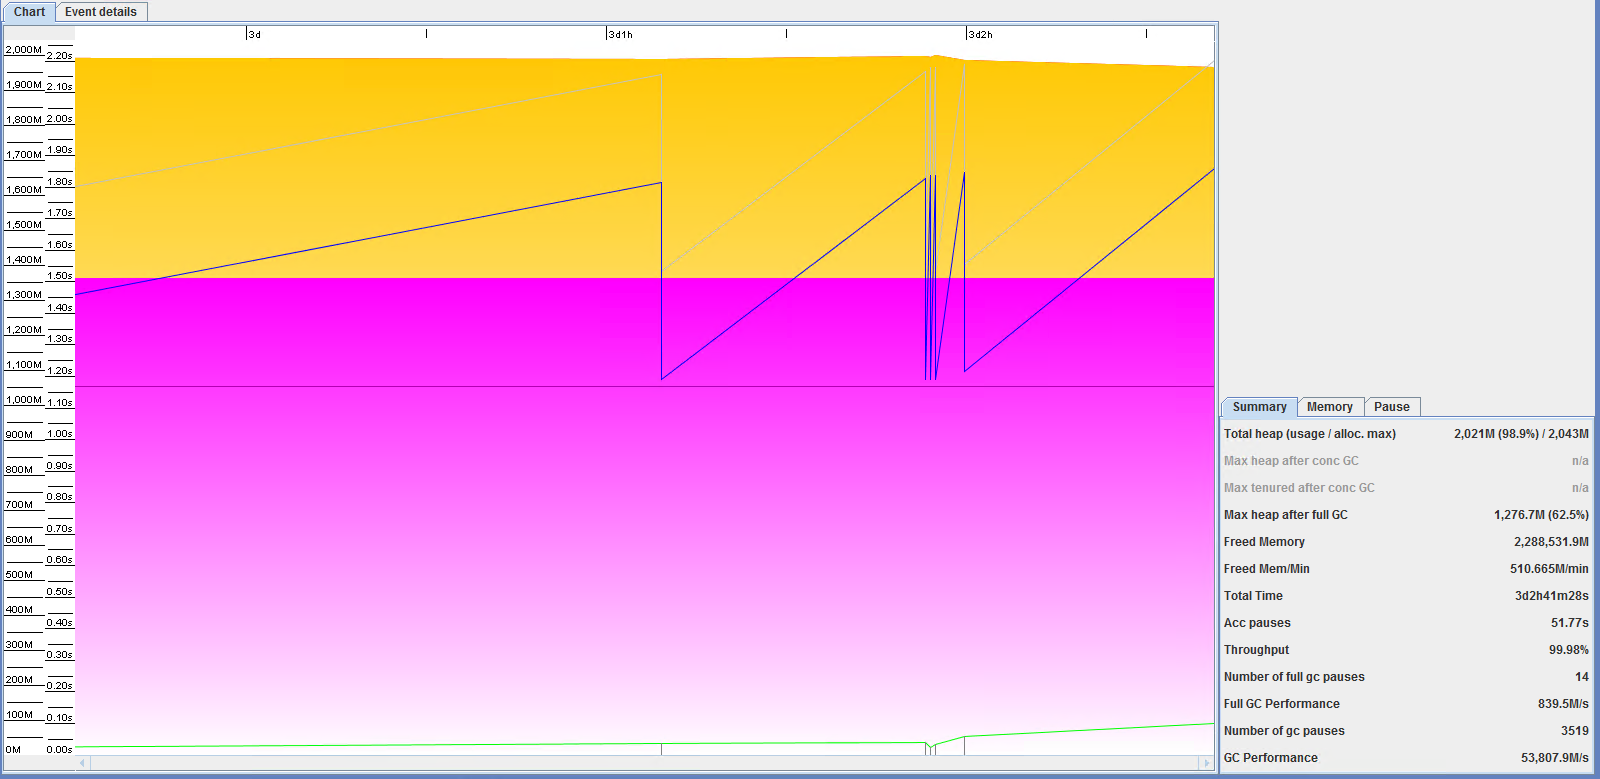
Copy link to clipboard
Copied
In GCViewer choose View to see a legend of the lines. Blue = heap. Heap is OldGen and NewGen (where New in turn is made up of Eden and 2 survivor spaces).
Copy link to clipboard
Copied
Ok. Yeah, I saw the toggles under view, but just wanted to be sure. Thanks.
Copy link to clipboard
Copied
Server's been up for a week or so. I guess it really just needed more Ram. Thanks for all the help.

Get ready! An upgraded Adobe Community experience is coming in January.
Learn more
 AdChoices