December 20, 2012
Question

I think I've got a memory leak and could use some advice

  • December 20, 2012
  • 6 replies
  • 5743 views

We've got ourselves a sick server/application and I'd like to gather a little community advice if I may. I believe the evidence supports a memory leak in my application somewhere and would love to hear a second opinion and/or suggestions.

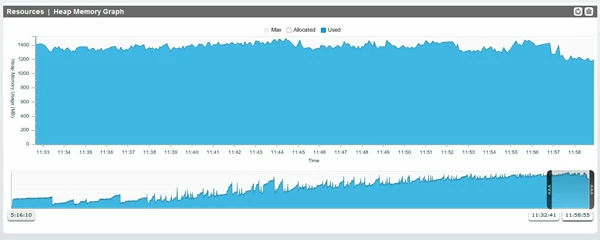
The issue has been that used memory (as seen by FusionReactor) will climb up to about 90%+ and then the service will start to queue requests and eventually stop processing them all together. A service restart will bring everything back up again and it could run for 2 days or 2 hours before the issue repeats itself. Due to the inconsistant up time, I can't be sure that it's not some trouble bit of code that runs only occasionally or if it's something that's a core part of the application. My current plan is to review the heap graph on the "sick" server and look for sudden jumps in memory usage then review the IIS logs for requests at those times to try and establish a pattern. If anyone has some better suggestions though, I'm all ears! The following are some facts about this situation that may be usefull.

The "sick" server:

- CF 9.0.1.274733 Standard

- FusionReactor 4.0.9

- Win2k8 Web R2 (IIS7.5)

- Dual Xeon 2.8GHz CPUs

- 4GB RAM

JVM Config (same on "sick" and "good" servers):

- Initial and Max heap: 1536

-server -Xss10m -Dsun.io.useCanonCaches=false -XX:PermSize=192m  -XX:MaxPermSize=256m -XX:+UseParNewGC -Xincgc -Xbatch -Dcoldfusion.rootDir={application.home}/../ -Dcoldfusion.libPath={application.home}/../lib -Dcoldfusion.dotnet.disableautoconversion=true

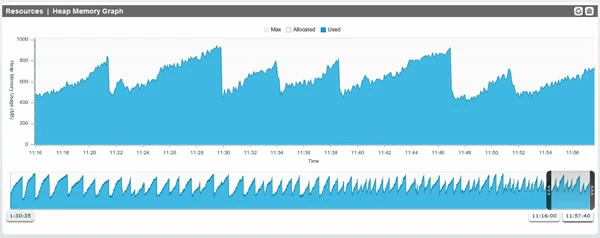
What I believe a "healthy" server graph should look like (from "good" server):

And the "sick" server graph looks like this:

This topic has been closed for replies.

6 replies

January 18, 2013

Update!

For some background, part of what our application does is receive email messages via HTTPS posts from a Java applet. CF scans the posted data and if there is a matching contact in the database, records the message and any attachments there may be. The CFC that handles all of this exchange is where the issue apparently was. I wish I could say we used some clever techniques to uncover this but we ended up making this discovery through trial and error.

There were a few parts of the application that were suspect due to how much work was done or how many requests they handled. From those, the most likely (and first) part we looked at was the email handling. We found that disabling the email handling (by using IIS to return a 403) the CF service stabilized and memory usage looked MUCH more reasonable (peaks at 600MB instead of 1000MB). Within 5 minutes of re-enabling the file we saw memory usage climbing again and the service was bogging down again about 4 hours later.

Our current solution is to offload the email handling part of the application to a separate server. Since making that change, the CF service on the primary application server has been running for two days with memory usage averaging around 30% used. Huzzah! At some point we will have to pull apart that CFC and I hope to find exactly where the issue was. I'll try to post those findings back here when we get there.

Lastly, I wanted to comment a little on JVM settings. We found that for our issue, using "-XX:+UseParNewGC -Xincgc" for GC worked better than the default of "-XX:+UseParallelGC". Using the default GC, with no other change to anything, the server could only manage about an hour or two before it hung and stopped processing requests. With the "UseParNewGC" setting, the service would still run memory up but it managed to stagger along much longer (with degraded performance) before hanging. We had the service setup with a scheduled restart every night and usually "UseParNewGC" could keep it up that long. I don't believe this is an answer for everyone, but it may be something to consider.

Thanks to everyone for the help!

January 2, 2013

It looks like while I was away there's been a flurry of activity here! Thank you both for your time!

@BKBK

  • On bugbase
    • I took a look at the bugs you mentioned and poked around in the bugbase  for related issues and I do see some similarities. Our application makes  extensive use of CFC's and some of those do persist in session and  application scopes. There are at least a few "batch" style scheduled  tasks that have the potential to instantiate many objects per request so  that's a good place to look.
  • On JVM memory settings
    • We're running Win2k8 R2 on this machine so it's guaranteed to be x64 (see here).  We actually started with 1024m as the min/max heap size but when we  started seeing issues with the memory topping out we thought it might  just need more so we increased the setting to 1536m.
  • On Xss
    • In our attempts at trying to find a solution we tried many different JVM  settings that we found around the web. As Charlie mentioned in one of  his replies, we're not terribly familiar with JVM arguments so we tried  all kinds of things. Our thought was: "the server is hanging pretty  regularly, if these settings don't work we can just roll them back.  Let's try it and see".  We also changed the GC type from "UseParallelGC"  to "UseParNewGC" in an attempt to get something better working for GC.  We can certainly try a restore to the server default JVM arguments if  that would put us in a better place to really solve this.

@Charlie Arehart

  • On wow, that's a lot of information
    • Thank you very much for taking the time to post all of that information. I really appreciate the help!
  • On session counts
    • We've run into this issue before on a different server and ended up  finding some information on Ben Nadel's site about setting the session  duration very low for spiders/bots and setting it normally for user  agents that appeared to be humans. Making that change seemed to help  that server keep it's head above the water much better. To be honest, we  hadn't considered session counts for our current "sick" server because  this server runs only one application and 95% of what it does is behind a  login.

      I put a copy of the tool from  learnosity.com you suggested on the server this morning to have a look. FusionReactor  is showing the same high memory usage but this tool is reporting the  total session count as 279. I'm not sure if there is a way to get any more of a breakdown on how much of the memory used is from sessions or how much for each session.
  • On high memory
    • I suppose what got us on the "memory is a problem" path was seeing the % used listed in FusionReactor. When the server is acting up we've gotten in the habit of opening FR and using the "Running Requests" page to get an idea of what's going on. Seeing the % memory used up between 90 - 100% seemed like a red flag to us so we started down that road.

      When we first started looking into the issue we had come across some samples of CF code that could be used to request and force a system GC. The next time the "sick" server had a problem, we opened FR and looked at the "Running Requests" page to see the % used was ~90%. We ran the code to force a GC and then watched the % used (with refresh set to 2 seconds) but it only dipped about 5% and then climbed right back. Later, after a service restart we tried the same process and watched the memory used fall from ~45% to ~15% before starting to climb back up. That seemed to indicate there was a point where CF started having trouble recovering memory with a GC. I had actually forgotten about that little button in FR to request a GC. I tried doing that this morning just to see if there was any difference but the result was the same (yes the server has issues so frequently I can *almost* test things on demand).

      You are spot-on about the JVM argument. See my comments to BKBK above on this.
  • On out of memory
    • This is more of an observation in FR than the result of seeing errors in the CF logs. I combed through the /logs/exception.log and /runtime/logs/coldfusion-out.log and was surprised to find relatively few instances of "java.lang.OutOfMemoryError: Java heap space". There were maybe a dozen in the last month.
  • On request queuing
    • I probably should not have used the word "queuing" to describe the issue. We've used the "Queued Requests" counter in performance monitor before to see when CF records requests being queued but that does not appear to be happening in this case. What actually happens (and I don't know how it doesn't queue) is that the running requests climb to maximum and then just spin (as seen in FR and PerfMon counters). They will do this for a few tends of seconds and then I guess they either time out or complete. The server usually can chew through these requests eventually but the issue is that it happens again and again which causes the whole application to bog down. Sometimes the service will actually hang and must be killed in Task Manager.
  • On server differences
    • My apologies, I completely missed reporting what the "good" server build is! The "good" server is a different model server than the "sick" server but has nearly the same specs. It does play a very different role for us though. The "sick" server runs only one application and 95% of it is behind a login. The "good" server is a general web server that has probably 150+ websites that range from simple "info" sites to complex ecommerce sites.

      The "good" server
      - CF 9.0.1.274733 Standard
      - FusionReactor 4.0.9
      - Win2k8 Web R2 (IIS 7.5)
      - Dual Xeon 2.3Ghz CPUs
      - 4GB RAM

All of this information has lead me to ask myself: is the high memory usage the cause of the stability issue or only a symptom? There's no doubt that running a GC when memory usage is high and CF is having an issue results in far less memory returned than when a GC is run when a moderate amount of memory is used. This still seems suspect to me as a general "memory" problem but we've noticed something else recently when CF starts to misbehave. I've been watching the Performance Monitor in Windows when things are having trouble and the counter for "DB Hits/Sec" looks like 0, 0, 15, 0, 100, 0, 5 when it normally looks like 30, 40, 45, 60, 40. I don't mean to jump down another rabbit hole but I wanted to report the observation just in case.

BKBK
Community Expert
Community Expert
December 27, 2012

@AmericanWebDesign,

Some questions and suggestions.

The "sick" server:

- CF 9.0.1.274733 Standard

- FusionReactor 4.0.9

- Win2k8 Web R2 (IIS7.5)

- Dual Xeon 2.8GHz CPUs

- 4GB RAM

JVM Config (same on "sick" and "good" servers):

- Initial and Max heap: 1536

-server -Xss10m -Dsun.io.useCanonCaches=false -XX:PermSize=192m  -XX:MaxPermSize=256m -XX:+UseParNewGC -Xincgc -Xbatch -Dcoldfusion.rootDir={application.home}/../ -Dcoldfusion.libPath={application.home}/../lib -Dcoldfusion.dotnet.disableautoconversion=true

Did you say whether your machine is 32-bit or 64-bit? I haven't seen that, so have assumed 32-bit. ColdFusion lore tells us that, on 32-bit machines, we should restrict the maximum heap size to less than 1.8GB. I would recommend the settings

-Xmx1024m -Xms1024m

A value of 1536 seems to me to be too high. We discussed this matter at some length in a previous thread on memory and garbage collection.

Why do you use the setting -Xss? In other words, why do you have to set a limit for thread stack size, and why 10m? Why not leave it up to ColdFusion? In essence ColdFusion is an elaborate Java application, with ample means to deal with thread stacks. My advice is to omit the -Xss setting, unless you are absolutely sure about its need.

Charlie Arehart
Community Expert
Community Expert
December 26, 2012

@AmericanWebDesign, I would concur with BKBK (in his subsequent reply) that a more reasonable explanation for what you’re seeing (in the growth of heap) is something using and holding memory, which is not unusual for the shared variables scopes: session, application, and/or server. And the most common is sessions.

If that’s enough to get you going, great. But I suspect most people need a little more info. If this matter were easy and straightforward, it could be solved in a tweet, but it’s not, so it can’t.

Following are some more thoughts, addressing some of your concerns and hopefully pointing you in some new directions to find resolution. (I help people do it all the time, so the good news is that it can be done, and answers are out there for you.)

Tracking Session Counts

------------------------------

First, as for the observation we’re making about the potential impact of sessions, you may be inclined to say “but I don’t put that much in the session scope”. The real question to start with, though, is “how many sessions do you have”, especially when memory use is high like that (which may be different than how many you have right now). I’ve helped many people solve such problems when we found they had tens or hundreds of thousands of sessions.  How can you tell?

a) Well, if you were on CF Enterprise, you could look at the Server Monitor. But since you’re not, you have a couple of choices.

b) First, any CF shop could use a free tool called ServerStats, from Mark Lynch, which uses the undocumented servicefactory objects in CF to report a count of sessions, overall and per application, within an instance. Get it here: http://www.learnosity.com/techblog/index.cfm/2006/11/9/Hacking-CFMX--pulling-it-all-together-serverStats . You just drop the files (within the zip) into a web-accessible directory and run the one CFM page to get the answer instantly.

c) Since you mention using FusionReactor 4.0.9, here’s another option: those using FR 4 (or 4.5, a free update for you since you’re on FR 4) can use its available (but separately installed) FusionReactor Extensions for CF, a free plugin (for FR, at http://www.fusion-reactor.com/fr/plugins/frec.cfm). It causes FR to grab that session count (among many other really useful things about CF) to log it every 5 seconds, which can be amazingly helpful. And yes, FREC can grab that info whether one is on CF Standard or Enterprise.

And let’s say you find you do have tens of thousands of sessions (or more). You may wonder, “how does that happen?“ The most common explanation is spiders and bots hitting your site (from legit or unexpected search engines and others). Some of these visit your site perhaps daily to gather up the content of all the pages of your site, crawling through every page. Each such page hit will create a new session. For more on why and how (and some mitigation), see:

http://www.carehart.org/blog/client/index.cfm/2006/10/4/bots_and_spiders_and_poor_CF_performance

About “high memory”

---------------------------

All that said, I’d not necessarily conclude so readily that your “bad” memory graph is “bad”. It could just be “different”.

Indeed, you say you plan to “look for sudden jumps in memory usage“, but if you look at your “bad” graph, it simply builds very slowly. I’d think this supports the notion that BKBK and I are asserting: that this is not some one request that “goes crazy” and uses lots of memory, but instead is the “death by a thousand cuts” as memory use builds slowly.  Even then, I’d not jump at a concern that “memory was high”.

What really matters, when memory is “high” is whether you (or the JVM) can do a GC (garbage collection) to recover some (or perhaps much) of that “high, used memory”. Because it’s possible that while it “was” in use in the past (as the graph shows), it might no longer be “in use” at the moment . 

Since you have FR, you can use its “System Metrics page” to do a GC, using the trash can in the top left corner of the top right-most memory graph. (Those with the CFSM can do a GC on its “Memory Usage Summary” page, and SeeFusion users can do it on its front page.)

If you do a GC, and memory drops q lot, then you had memory that “had been” but no longer ”still was” in use, and so the high memory shown was not a problem. And the JVM can sometimes be lazy (because it’s busy) about getting to doing a GC, so this is not that unusual. (That said, I see you have added the Xincgc arg to your JVM. Do you realize that tells the JVM not to do incremental GCs? Do you really want that? I understand that people trade jvm args like baseball cards, trying to solve problems for each other, but I’d argue that’s not the place to start. In fact, rarely do I find myself that any new JVM args are needed to solve most problems.)

(Speaking of which, why did you set the – xss value? And do you know if you were raising or lowering it form the default?)

Are you really getting “outofmemory” errors?

-------------------------------------------------------

But certainly, if you do hit a problem where (as you say) you find requests hanging, etc., then you will want to get to the bottom of that. And if indeed you are getting “outofmemory” problems, you need to solve those. To confirm if that’s the case, you’ll really want to look at the CF logs (specifically the console or “out” logs). For more on finding those logs, as well as a general discussion of memory issues  (understanding/resolving them), see:

http://www.carehart.org/blog/client/index.cfm/2010/11/3/when_memory_problems_arent_what_they_seem_part_1

This is the first of a planned series of blog entries (which I’ve not yet finished) on memory issues which you may find additionally helpful.

But I’ll note that you could have other explanations for “hanging requests” which may not necessarily be related to memory.

Are you really getting “queued” requests?

---------------------------------------------------

You also say that “the service will start to queue requests and eventually stop processing them all together”. I’m curious: do you really mean “queuing”, in the sense of watching something in CF that tells you that? You can find a count of queued requests, with tools like CFSTAT, jrun metrics, the CF Server Monitor, or again FREC. Are you seeing one of those? Or do you just mean that you find that requests no longer run?

I address matters related to requests hanging and some ways to address them in another entries:

http://www.carehart.org/blog/client/index.cfm/2010/10/15/Lies_damned_lies_and_CF_timeouts

http://www.carehart.org/blog/client/index.cfm/2009/6/24/easier_thread_dumps

Other server differences

------------------------------

You presented us a discussion of two servers, but you’ve left us in the dark on potential differences between them. First, you showed the specs for the “sick” server, but not the “good” one. Should we assume perhaps you mean that they are identical, like you said the JVM.config is?

Also, is there any difference in the pattern of traffic (and/or the sites themselves) on the two servers? If they differ, then that could be where the explanation lies. Perhaps the sites on one are more inclined to be visited often by search engine spiders and bots (if they sites are more popular or just have become well known to search engines). There are still other potential differences that could explain things, but these are all enough to hopefully get you started.

I do hope that this is helpful. I know it’s a lot to take in. Again, if it was easier to understand and explain, there wouldn’t be so much confusion. I do realize that many don’t like to read long emails (let alone write them), which only exacerbates the problem. Since all I do each day is help people resolve such problems (as an independent consultant, more at carehart.org/consulting), I like to share this info when I can (and when I have time to elaborate like this), especially when I think it may help someone facing these (very common) challenges.

Let us know if it helps or raises more questions. :-)

/charlie

/Charlie (troubleshooter, carehart. org)
Charlie Arehart
Community Expert
Community Expert
December 26, 2012

@AmericanWebDesign, I would concur with BKBK (in his subsequent reply) that a more reasonable explanation for what you’re seeing (in the growth of heap) is something using and holding memory, which is not unusual for the shared variables scopes: session, application, and/or server. And the most common is sessions.

If that’s enough to get you going, great. But I suspect most people need a little more info. If this matter were easy and straightforward, it could be solved in a tweet, but it’s not, so it can’t.

Following are some more thoughts, addressing some of your concerns and hopefully pointing you in some new directions to find resolution. (I help people do it all the time, so the good news is that it can be done, and answers are out there for you.)

Tracking Session Counts

/Charlie (troubleshooter, carehart. org)
Charlie Arehart
Community Expert
Community Expert
December 26, 2012

That's really odd. My reply above was chopped off when (in my reply, written via email) I used a set of dashes to mark a "section" of the email (starting with "Tracking Session Counts"). Wow, I've never seen this forum software do that before.

I'll offer another reply in a moment (written here in the forums) with the full content.

And as a test, let me see if dashes in the forum's wysiwyg editor has the same problem:

This is a test

---------------

And this is a line following that.

/Charlie (troubleshooter, carehart. org)
BKBK
Community Expert
Community Expert
December 22, 2012

The ColdFusion bugbase has at least two bug reports on excessive memory usage in CF 9.0.1, 3124148 and 3419777. Check and see if the reported cases are similar to yours.

In my experience, one typical scenario usually causes this kind of memory usage. Namely, when a large number of objects are being generated or loaded into memory, particularly in a persistent scope such as Application or Session. 

There is one way to find out. Go to the ColdFusion Administrator's Server Monitor page. Choose to "Launch Server Monitor". Click on Statistics, then on Memory Usage. Examine the various memory users, one by one. Any big users, nay, abusers?

Charlie Arehart
Community Expert
Community Expert
December 26, 2012

@BKBK, just a couple of thoughts, to perhaps help you or other readers, with regard to your suggestion about using the CF Server Monitor to monitor memory usage.

1) First, and no offense intended, but note that AmericanWebDesign said they were on CF Standard, so that won’t be there for them sadly. You mauy just have missed that they said that.

2) But more important (since you do have it, and for readers who do), you said that to help resolve memory usage problems they should “click on Statistics, then on Memory Usage. Examine the various memory users, one by one. Any big users, nay, abusers?”

Well, let’s be clear: most of those pages will show nothing unless one has turned on the “start memory tracking” button at the top. And as you (and others) may know, for many, doing that could be a killer of their CF instance. I’ve got some blog entries relate to this that may interest some readers:

http://www.carehart.org/blog/client/index.cfm/2007/6/15/cf8_monitor_impact_on_prod

http://www.carehart.org/blog/client/index.cfm/2012/2/24/CF_Server_Monitor_start_buttons_remain_enabled

http://www.carehart.org/blog/client/index.cfm/2012/2/24/CF911-Stopping-the-ColdFusion-Server-Monitor-start-buttons-when-you-cant-get-into-the-Monitor

3) Beyond that, some may notice that pages like the “application scope memory usage” and “server scope memory usage” WILL in fact show info, even with memory tracking off. But note that the size column on the app scope page are 0, if memory tracking is not on.

More important, if you drill into a specific application (or a specific session, on the Active Sessions page), beware that while you MIGHT see it listing variables and values there (and their sizes!), do beware that you ONLY SEE SIMPLE VARIABLES (strings, numbers, booleans) if you have not turned on “memory tracking”. You will NOT see arrays, structs, queries, CFCs, and such if you have variables holding those (the variables won’t even be listed).

Hope that helps.

/charlie

/Charlie (troubleshooter, carehart. org)
BKBK
Community Expert
Community Expert
December 26, 2012

Charlie Arehart wrote:

@BKBK, just a couple of thoughts, to perhaps help you or other readers, with regard to your suggestion about using the CF Server Monitor to monitor memory usage.

1) First, and no offense intended, but note that AmericanWebDesign said they were on CF Standard, so that won’t be there for them sadly.   You mauy just have missed that they said that.

Yes, I asumed AmericanWebDesign has access to the server monitor. Sorry about that.

However, not all is lost. You can create your own server monitor(of sorts) for CF 9 Standard. You could, for example, use jconsole to monitor your ColdFusion server. See the last part of a previous post of mine on Jan 1, 2012 3:40 PM.