Participating Frequently
September 10, 2014
Question

Visual representations of color spaces

  • September 10, 2014
  • 1 reply
  • 27715 views

I copied these diagrams from the program called Color Space ...

Can be downloaded from here: COULEUR.ORG

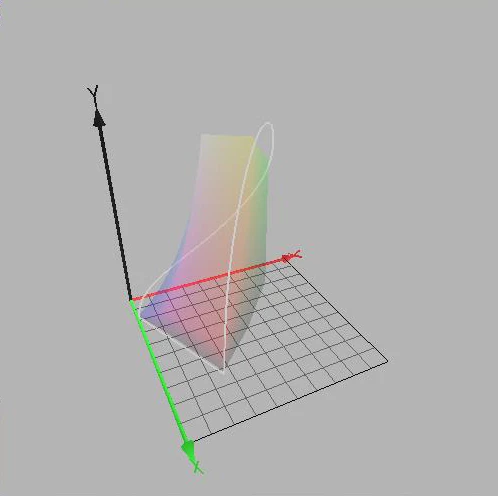
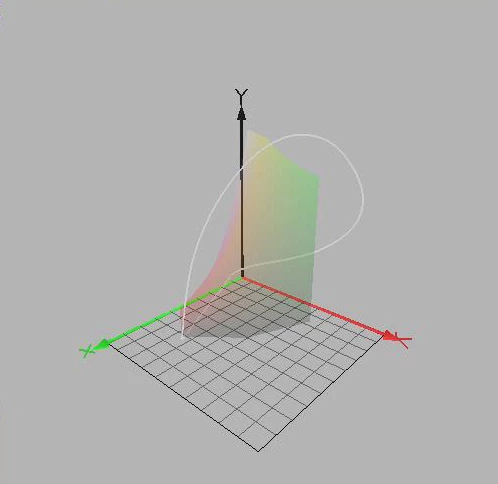
I think that it draws spectral locus on xyY by just plotting matching x, y and Y values for every interval of monochromatic lights on the spectrum ... just like we draw the locus line in XYZ by plotting matching tristimulus values X, Y and Z.

Because the underlying data for the most saturated colors human can see is CIE XYZ color matching functions, I think that we can draw the line of spectral locus in every model originated from CIE XYZ by just making necessary transformations to the XYZ tristimulus values for the intended model.

3D representation of the entire human gamut is more tricky, I think. I will ask about it, after getting your confirmation about the spectrum locus.

    This topic has been closed for replies.

    1 reply

    Inspiring
    September 11, 2014

    Without further explanations these graphics are rather dubious, in my humble opinion.

    http://docs-hoffmann.de/ciexyz29082000.pdf

    On p.8 we can see, how XYZ is mapped onto the plane X+Y+Z=1 as coordinate system xy
    by a perspective projection:

    The original Y-axis is not orthogonal to the plane xy, therefore the quoted diagrams
    are not correct. It's of course possible to construct a kind of substitution Y* orthogonally
    to xy.

    As long as we are talking about unrelated colors, like an arbitrary set of spectral light
    sources with arbitrary radiant powers, the human gamut in XYZ is indeed a cone,
    which has its vertex at X=Y=Z=0 and which intersects the plane X+Y+Z=1 by this
    horseshoe curve (plus purple line for mixtures of extreme spectral red and blue).

    About power:

    http://en.wikipedia.org/wiki/Radiant_flux
    "radiometric power", correctly: radiant power or radiant flux

    The situation becomes different under certain circumstances where the unlimited cone is
    replaced by a finite volume or by finite curves on this cone:

    1) The radiant power of the spectral light sources is limited and equal, e.g. 1 Watt.
        The curve on the cone shows the spectral loci. In Wyszecki&Stiles in chapter 3.3.3
        in Fig. 4(3.3.3) exactly this situation is illustrated: we can see the cone, the horseshoe and

        the spectral locus on the cone.
        As already mentioned, this issue has been further evaluated by Jim Worthey ("amplitude
        not left out" and illustrated by me and of course by himself  (see references):
        http://docs-hoffmann.de/jimcolor12062004.pdf

    2) The volume of Optimal surface colors, concept by Roesch, as already explained.
        Fig. 5(3.7) in W&S shows Y orthogonally over xy, which is not correct, but we understand
        the meaning. This 'wet sack' has on top Y=100, which is the luminance of the illuminant.

    3) A color space is a subset of a finite gamut volume in XYZ. There is always a white point and
       nothing can become brighter than the white point. An RGB space is represented in XYZ by an
       affine distorted cube. Mapping to xy delivers a triangle, but here we can see, what happens

       if the "amplitude is not left out":
       http://docs-hoffmann.de/ciegamut16012003.pdf
       The sections Y=const. with the dark sides of the cube appear still as triangles, but the sections

       with the bright sides by other polygons (p.12 for sRGB).

       A threedimensional graphic would be possible, Y over xy.

    Best regards --Gernot Hoffmann

    Participating Frequently
    September 11, 2014

    http://docs-hoffmann.de/ciexyz29082000.pdf

    On p.8 we can see, how XYZ is mapped onto the plane X+Y+Z=1 as coordinate system xy
    by a perspective projection:

    The original Y-axis is not orthogonal to the plane xy, therefore the quoted diagrams
    are not correct. It's of course possible to construct a kind of substitution Y* orthogonally
    to xy.

    I think that this line in these diagrams may be V(λ) in 3D space.

    In place of plotting it over the spectrum axis in 2D, we plot it here over the chromaticity plane.

    As the y-bar matching function is exactly same with the photopic luminous efficiency function ...

    By plotting Y values over xy chromaticity diagram, I think that we indeed draw V(λ) function in 3D space, over the chromaticity plane.

    Not sure, I may be wrong?

    Thanks a lot for other points, but I need to think about them a little before asking additional questions