
Answered
Debug console not working correctly
Hello,
I have two versions of Adobe InDesign installed on my computer (CC 2017 and CC2018).
I am creating an extension for both versions.
I use grunt-cep for building and launching my extension (in release or debug mode).
Debugger tools worked well on InDesign CC2017 when I had only this one installed.
Now that I have both, if I run in debug mode my extension on InDesign CC2018, debugger tools work as expected.
But if I run my extension in debug mode on CC2017, debugger tools doesn't work properly :
- - Sometimes, I have my panel listed, but not linked to debug window (cannot access it)
- - Sometimes, I can access to it but :
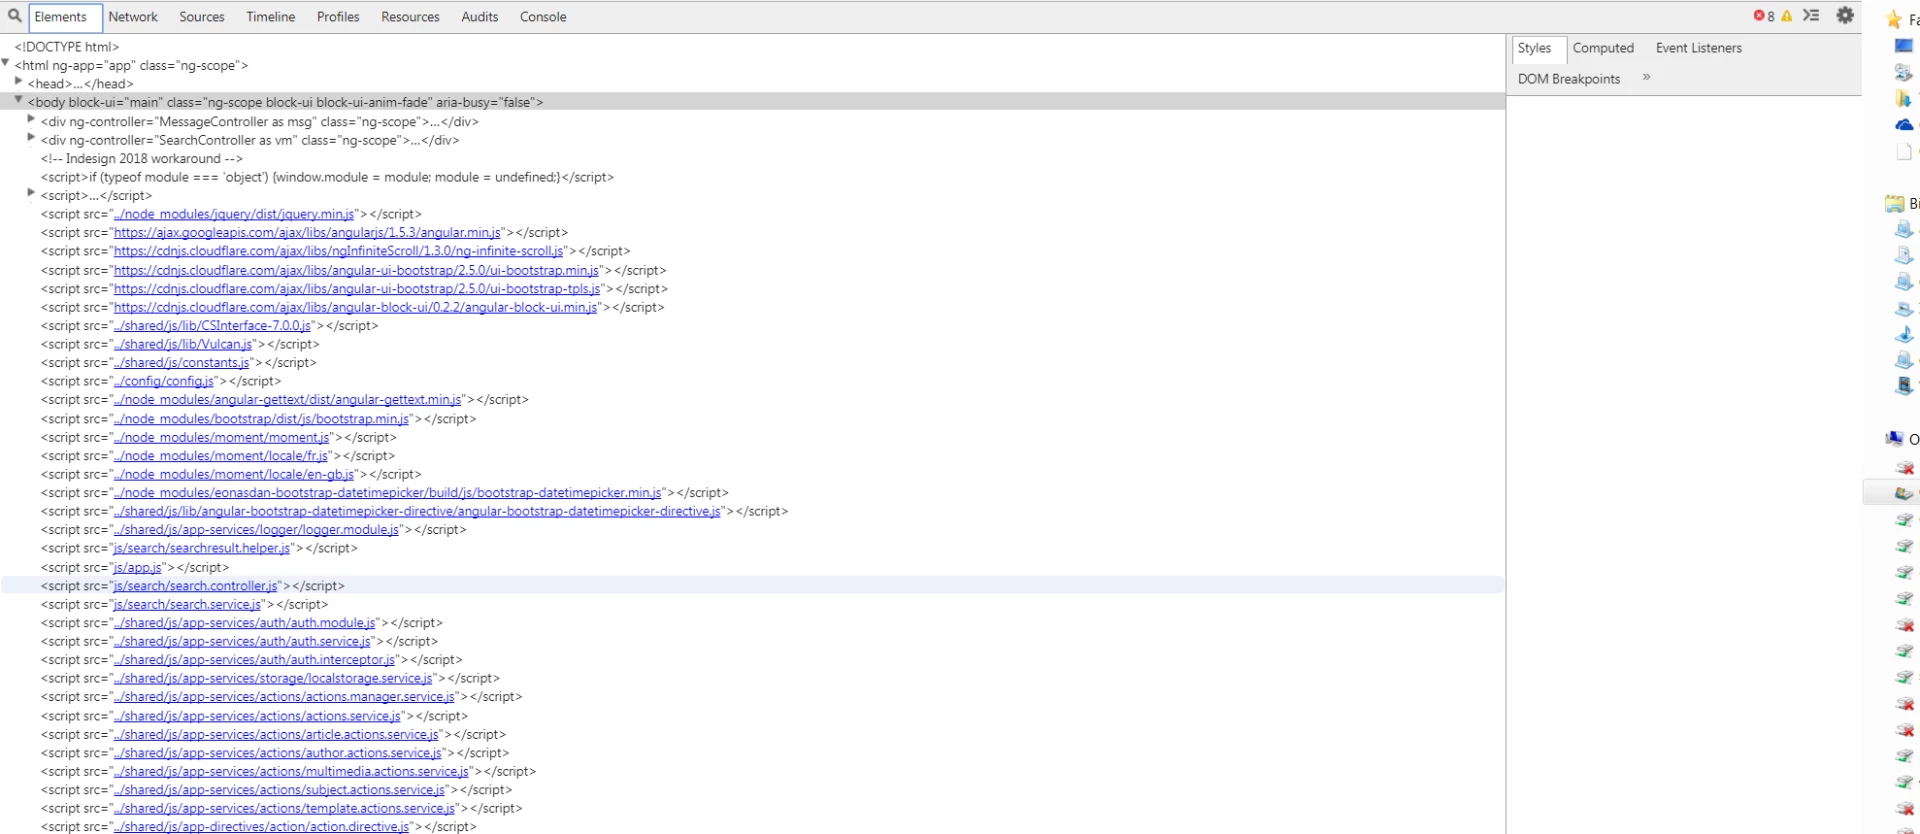
- - elements panel is empty ; I have to switch to another, close debug, and go back to have them. But I cannot see CSS ... (this is my main problem)
- - console panel as no scrollbar .. I cannot access to all logs
- - some panels are just "broken" ; i can see only a part of them
Don't know what I can do to solve that ... My register key for PlayerDebugMode seems Ok ...
Thanks in advance