

- Home
- Exchange
- Discussions
- Re: ExtendScript Debugger v1.x Needs a Rethink
- Re: ExtendScript Debugger v1.x Needs a Rethink
ExtendScript Debugger v1.x Needs a Rethink

Copy link to clipboard
Copied
[This was originally posted in another private forum here. Moved to this forum for more open discussion and link-ability.]
TL;DR
The ExtendScript Debugger has some serious problems that stem from its current implementation. In summation, the debugger does not work like other debuggers in VSCode (e.g. NodeJS) [or any other mainline IDE debugger (that I'm aware of)], which is the default expectation for any user. Specifically this means:
- The debugging session appears to stop immediately after being run.
- Compound Launch Configurations cannot be used.
- VSCode Breakpoints do not work unless very specific, non-obvious configuration settings are in place.
- VSCode Breakpoints might mysteriously fail to work, even with the non-obvious configuration settings in place.
All of the above issues are related to the current way that the ExtendScript Debugger extension handles a "Debug Session". Addressing these issues will very likely mean changing how this is performed. For more information, please see the following sections.
Beyond TL;DR The Expectations
As a user, I expect the ExtendScript Debugger to work exactly like any other debugger I interface with in VSCode. This means the following:
- A debug session lasts from when I click the "Start Debugging" button (or command) until I click the "Stop Debugging" button or the target context stops of its own accord (e.g. application closes).
- When the debug session is not running there is no connection between the target context and VSCode.
- When I adjust breakpoints while a debug session is active but not stopped, the debug session will respond accordingly.
The Default Reality
The reality is extremely different from the expectations. With a default configuration, the debugger has the following characteristics:
- With no breakpoints set, the debugger will appear to stop immediately after starting.
- With breakpoints set, the debugger might appear to stop immediately after starting. This depends on the context in which the breakpoints exist:
- Top level statement: Yes.
- Un-invoked Function declaration: No.
- No clear way to make the Debug Session last long enough to trigger a function from a CEP panel via CSInterface.evalScript().
That the debugger starts and stops immediately is extremely confusing. It really seems like there's no way to have the debugger exist in a "standby mode" that is capable of breaking on runtime script logic.
The Advanced Reality
By setting the debugLevel: 2 configuration option in the launch.json file, it is possible to coerce the VSCode Debugger Extension to actually handle breakpoints in runtime script logic. However, this results in the following quirks:
- The debugger will always stop at the first line of the script specified in the program configuration option when the "Start Debugging" action is triggered (button/command/etc.).
- The debugger appears to automatically start when a specified breakpoint is hit.
- Modification of breakpoints (add/remove/update) in the VSCode interface are not communicated to the background debug session automatically. This can result in the following confusing scenarios:
- Remove breakpoint: Ghost breakpoint triggered. "VSCode halted where no breakpoint is set!"
- Add breakpoint: Existing breakpoint ignored. "VSCode ignores my breakpoints!"
- Attempts to use Compound Launch Configurations do not work as expected. This would be a natural thing to try given that one may wish to attach to both the HTML and ExtendScript engines in a single debug session.
Beyond the above surprising quirks, the current implementation appears to leave a connection to a Host Application open at all times. The ExtendScript Debugger is put into a Polling mode with no clear way to break that connection.
Matching the Reality to Expectations
Adjusting the ExtendScript Debugger to operate more closely with expectations should be possible. Specifically, adjusting the extension to run as follows should go a long way to help:
- Create a connection to the host application and begin polling when the user explicitly Starts a debug session.
- Do not automatically stop the debug session unless the it ends for some unforeseeable reason (e.g. host application exits).
- Close the connection to the host application and stop polling when the user explicitly Ends a debug session.
- Watch for breakpoint changes in the adapter and update the active ExtendScript debug session live.
ExtendScript Debugger isn't "ESTK in VSCode"
The current functionality appears to attempt to emulate the "Play/Run" button in ESTK. The problem is that VSCode's debugging facilities are expected to run in a very different manner. This doesn't mean that you shouldn't support the ability for someone to write script and run it in a host application, just that you shouldn't rely on the debugger to do so. The ExtendScript Debugger should be adjusted to support the following features:
- A default debugging experience that works as near as possible to other debugging experiences in VSCode (see the previous section).
- A "Run Script in Target Host" command feature that runs the currently focused JS/JSX script in a selected target application.
- A "Debug Script in Target Host" command feature that effectively works the same as the default configuration does today.
- A "Connect Console to Target Host" command feature that provides the user with a console interface for a given engine on a target host so that they may issue direct commands to it (and possibly show a live-updated set of global data as with the ESTK Data Browser?).
Such an approach should do a good deal to clear things up for users and offer them desirable features that they have grown accustomed to with ESTK.


 23
Replies
23
23
Replies
23
Copy link to clipboard
Copied
I'll add a bit more information on why I say that it should be possible to implement the debugger as suggested in the initial post.
Both ESTK and the ExtendScript Debugger extension for VSCode send and receive information about the debug session. In fact, both of those applications are capable of setting breakpoints and instructing the target ExtendScript engine's internal debugger session on how to perform.
To make the ExtendScript Debugger extension perform as I've described, you merely need to do this:
- When the user Starts Debugging:
- Connect to the target app.
- Tell the target app+engine what breakpoints are active.
- Set debugLevel: 2 or whatever is necessary.
- Begin polling.
- When the user adjust breakpoints in the VSCode UI (add/move/remove a breakpoint; change a condition; etc.), the extension updates the target app+engine with the active breakpoints.
- When the user Stops Debugging:
- Tell the target app+engine that no more breakpoints are active.
- Set debugLevel: 0.
- Stop polling.
- Disconnect from the target app.
[The above could also work for the "Debug Script in Target Host" command I suggested in the initial post.]
The only further complication may be the existence of the $.bp(...); and debugger; statements (and possibly the $.level property (assuming this is similar to debugLevel). As these are user-controlled, however, you would simply instruct users to not use these features when working with the ExtendScript Debugger for VSCode. Users shouldn't actually need those statements if they're able to control a session as outlined above (specifically when they have access to realtime breakpoint control).
This isn't rocket science and it really shouldn't be that hard to build. The main difference here is that you don't think of the extension as a "Debug Handler" but as a "Debug Controller". As I understand it, the ExtendScript/BT protocol provides you with everything you need to setup and control a Debug Session in VSCode in this manner. Benefits of this approach would include a debugging experience that matches almost every other debugging experience out there and the ability to use standard VSCode features (e.g. Compound Launch Configurations).
Copy link to clipboard
Copied
sberic wrote
The only further complication may be the existence of the $.bp(...); and debugger; statements (and possibly the $.level property (assuming this is similar to debugLevel). As these are user-controlled, however, you would simply instruct users to not use these features when working with the ExtendScript Debugger for VSCode. Users shouldn't actually need those statements if they're able to control a session as outlined above (specifically when they have access to realtime breakpoint control).
Actually, I just verified how debugger; statements work in the Chrome DevTools:
- DevTools is Open: Trigger a breakpoint.
- DevTools is Closed: Do nothing.
The point here is that debugger; statements are entirely ignored unless Chrome's debugging session is open. This holds true for the Debugger for Chrome extension for VSCode as well:
- Debugging Session Active: Trigger a breakpoint.
- Debugging Session Inactive: Do nothing.
As a user, I would expect that the ExtendScript Debugger work in the same manner. I should be able to freely add debugger; statements and calls to $.bp() wherever I choose but only have them trigger when a debugging session is active.

Copy link to clipboard
Copied
These are some excellent recommendations. I hope Adobe modifies debugger to produce these behaviors.
Copy link to clipboard
Copied
Unfortunately, this all still applies to the just-released v1.1.0.
I realize that the above discussion is extremely detailed and therefore makes it difficult to really get an understanding of what the main suggestions are. I'll try to simplify here.
The two main points I was trying to make:
- “Run in Host Application” and “Debug” should be two entirely separate actions.
- A BridgeTalk connection to a host application should only ever be active while the VSCode Debugger is active. In other words, it starts when I say “Start Debugging” and it stops when I say “Stop Debugging”.
Given the above, the extension itself should manage connection state such that the following actions are properly sent to the host application while the Debugger is active (and thus the extension has an open BridgeTalk connection to the host application):
- Breakpoint changes.
- “Run in Host Application” action.
These changes would suddenly make the ExtendScript Debugger work like the Chrome Debugger in a browser. You can have debugger; statements in your JavaScript and it doesn’t automatically open the browsers Developer Tools, right? It will only actually stop if a Developer Tools window is active for that browser tab. ExtendScript debugging should work the same way: if I don’t attach a Debugger to my host application, then debugger; statements in my ExtendScript are simply ignored by the host application.
If the ExtendScript Debugger worked as above, you could also drop "features" automatically activating when a “js” or “jsx” file is active in VSCode (which is silly because JavaScript is an extremely common programming language [see: browser, server, etc.]).
As it stands, the ExtendScript Debugger is effectively useless for CEP/ScriptUI development. That said, it may work fine for you if your purpose is to simply "Run a JavaScript".

Copy link to clipboard
Copied
So I've been trying this workflow and having a hard time getting it to work - maybe you can help.
1. I have a script that runs on startup - it's in InDesign's Scripts > startup scripts folder
2. I have debugLevel: 2 in my configuration file. I've also tried putting a `level = 2;` statement at the start of my script
3. I have put both breakpoints and `debugger;` statements in my script
4. My breakpoints are never triggered
Any thoughts on what I'm missing here?
Thanks!
Lawrence

Copy link to clipboard
Copied
Hi Lawrence!
So, I've talked a lot with @sberic about this, and verified it myself, and there's definitely some weird breakpoint issues in the ExtendScript Debugger. If you set `debugLevel: 2` you definitely get some weird breakpoint behavior. I've found if you put in breakpoints, then take them out, the next time you run the script the breakpoints get hit again anyway, even though they're gone. sberic calls this "ghost breakpoints". But that's the opposite of what you're describing, I think.
I'm going to paste in some of our conversation below that might be relevant. Also potentially related, there's a bug report numbered UXP-10147 about the write.ln behavior.
So when you set a breakpoint in the ESTK UI, that triggers the ESTK to send a message over BridgeTalk to the host app instructing it to set a breakpoint (or otherwise update its current breakpoint settings).
When you set a breakpoint in the VSCode Debugger, that doesn’t trigger anything. Instead, the host app is only notified of breakpoint changes when you hit the “Start Debug Session” button or command in VSCode.
[...]
The VSCode-side Debug Session is automatically killed after the specified script is run to completion. This is why you always get that crazy “orange flash” when you click the “Play” or “Start Debug Session” button/command in VSCode with the ES Debugger extension. It is built to go:
*1)* Start VSCode Debug Session!
*2)* Update Host Breakpoint Definitions and Debug configuration (e.g. `debugLevel`)!
*3)* Run Script!
*3.a)* _Break on any configured breakpoints!_
*3.b)* _Output any console output to the Debug Console!_
*4)* End VSCode Debug Session! (edited)
That all happens in the blink of an eye if you don’t trigger any breakpoints when your script is run in step 3 above.
Let me know if this is helpful or if I'm on the wrong track!
Copy link to clipboard
Copied
LSH_246 wrote
1. I have a script that runs on startup - it's in InDesign's Scripts > startup scripts folder
2. I have debugLevel: 2 in my configuration file. I've also tried putting a `level = 2;` statement at the start of my script
3. I have put both breakpoints and `debugger;` statements in my script
4. My breakpoints are never triggered
Any thoughts on what I'm missing here?
I have a few questions about your setup:
- How are you starting InDesign? Are you launching the app directly or allowing the Debugger extension to do so when you attempt to connect the debugger? (I'm not entirely sure that this is actually supported...)
- Is your startup script run in the main engine or the session (or custom) one? Put another way, does your startup script run "asynchronously" (insofar as it responds to events in the app during its lifecycle beyond startup/initialization)?
I have some ideas on what's going on but don't want to guess without more information...
Copy link to clipboard
Copied
Thanks ErinF and sberic. I've generally had this problem whether I launched InDesign from VSCode or manually. I've put together a sample script here. This can be run from the startup scripts folder or from VSCode. Here's the script:
function EventManagerSimple() {
};
EventManagerSimple.prototype.attachListeners = function () {
app.addEventListener(Event.AFTER_CONTEXT_CHANGED, this.handleAfterContextChanged);
}
EventManagerSimple.prototype.handleAfterContextChanged = function (eventInfo) {
$.level = 2;
debugger;
alert("Context changed!");
}
var manager = new EventManagerSimple();
manager.attachListeners();
So theoretically it should break at line 10 when you add a new doc or switch docs.
I've found that if I run this from VSCode, then when I add a new doc or switch docs, ExtendScript toolkit will launch and and start debugging at the beginning of handleAfterContextChanged! Funky.
But still a PITA. I'll try uninstalled ESTK and see if that helps.
Copy link to clipboard
Copied
Hi @LSH_246,
Whoa, you shouldn't have to uninstall ExtendScript Toolkit! You can just disable the ExtendScript Debugger in VSCode if you want to go back and forth between the two.
In fact, if you're on a Mac, reinstalling ESTK can be a pain...
Anyhow, I'm asking Arun about the breakpoint issues.
Best,
Erin F.
Copy link to clipboard
Copied
LSH_246 Can you post the contents of your launch.config file? It's possible that your specific settings are incompatible with the current approach.
It honestly sounds like you have your launch configuration mode set to passive, which would break any attempt to perform "asynchronous" debugging...
Copy link to clipboard
Copied
sberic you're correct, my extensionMode attribute was set to passive and needed to be active. Changing that caused the debugger; commands to break.
However, I'm still having issues with ESTK launching unexpectedly. ErinF the issue isn't that I want ESTK - it's that I don't. I want to work and debug in VSCode, but frequently VSCode will give an error and then ESTK will launch and the break points will then only be triggered in ESTK. When it happens again I'll get the exact error message and post it here.
I'm working on Windows 10.
Copy link to clipboard
Copied
Okay, I've isolated it a bit. First of all, I can't get the debugger to start unless I launch InDesign from VScode by launching some script - it can be anything, just a one line alert script. But after that, the debugger; statements in my CEP code will trigger the debugger and I can start debugging - very nice.
I also have a listener that I add through a script in the `startup scripts` folder. I need to catch and react to these events whether my CEP panel is open or not, which is why it's there.
The problem arises after I start debugging via breakpoints triggered in my CEP panel, and then do something the trigger my event listener. Then VSCode breaks on my event listener, and when I try and step forward or continue, I get the following error:
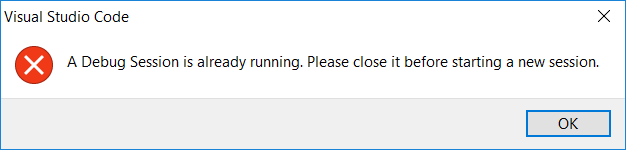
Then InDesign is frozen til I quit VSCode. When I do, ESTK starts up, and from this point onward I can only debug in ESTK.
Copy link to clipboard
Copied
LSH_246 I'd be willing to bet that your startup script is running in a separate #targetengine from the one the one that the debugger initially connects to. If you aren't specifying a custom target engine in InDesign, it defaults to "main" which, in InDesign only, creates a single-use session, temporary session for the duration of your script's run. I don't think the ephemerality of the "main" engine should matter in this case.
What matters, however, is that in order for your startup script to be "asynchronous"; in order for it to continue to respond to/trigger events after it's been run at startup, you have to specify a specific custom engine (a commonly used one is "session", which is shared by any script that specifies that engine - you could also specify your own custom one [because you're using InDesign where this is supported] by having something like "LSH_246_session").
I'd be willing to bet that your startup script either has its own distinct custom target engine specified or none at all. Either way, this will cause the ExtendScript Debugger to create a single debug session that is locked to the engine you specify (probably the default: "main"). Then, when the custom engine in your startup script attempts to notify the ExtendScript Debugger that it has a breakpoint that needs to be handled (via the debugger; statement), it won't handle it because its own debug session is already connected to a different engine.
As it exists today, you cannot debug more than one Target Engine at a time with the ExtendScript Debugger. I've not tried it but you might be able to coerce the ExtendScript Debugger to connect to the other engine by changing your Target Engine setting in the config and pressing "Start Debug Session" to update the "live" configuration.
Try this: adjust your launch.config such that the engineName is the same as the #targetengine that you specify in your startup script (you may also have to ensure that the #targetengine specified in your simple "dummy script" is also the same).
This, by the way, is another reason that I think the ExtendScript Debugger Needs a Rethink: absolutely none of the above is obvious, nor works as any standard user would expect given the standard VSCode interface. Hopefully Adobe will address this soon.
Copy link to clipboard
Copied
sberic good thought, but no - all the scripts have the same engine name.
- The CEP panels have their engine name defined in the CSXS file in the `Engine` attribute of the `ScriptPath` element.
- The debug instances have their engine named defined in the VSCode debug config info using the `engineName` attribute
- The event listener in the startup scripts folder has the target engine defined using the `//@targetengine "enginename"` syntax
Agreed that none of this is intuitive - lots of gotchas beyond what the documentation covers. I've now removed my startup script from the equation and I still have trouble consistently debugging my CEP scripts. It's easy to get it into a state that requires a restart.
Copy link to clipboard
Copied
LSH_246 if all of those are indeed set to the same value (e.g. "session") then it sounds like we'll need some Adobe developers to chime in here.
That said, I do have a guess for something that you could try: what happens if you include your "startup" script in your "debug instance" script? So instead of a "simple alert" in the script you specify in the config, you specify the startup script with something like "//@include 'startupScript.jsx'". You can use standard JavaScript checks to skip re-evaluation (e.g. check for the existence of your EventManagerSimple object before running the declaration code).
How might this help? It's possible that the ExtendScript Debugger extension is attempting to start a new VSCode-side Debug Session because the script it's being informed of (by the ExtendScript Virtual Machine) isn't actually "defined" in the same "program unit*" that spawned the existing VSCode Debug Session. As a result, when your debugger; statement triggers, the ExtendScript VM engine sends a new (second) "connect-request" message to listeners (which is the ESTargetStartedSessionListener in the ExtendScript Debugger extension) with the source program specified. The ESTargetStartedSessionListener code goes on its merry way attempting to start a new Debug Session (as it did previously), not realizing that a debug session that it previously spawned is still working.
My guess here is that a single "program unit" includes the specified script and any script that the specified script itself invokes or otherwise processes (likely through either the //@include preprocessor directive or whatever script commands are available in the host application...).
* The "program unit" term isn't anything official, so far as I'm aware. I picked it because this approach feels a bit like how the C/C++'s compilation/translation units work...
Copy link to clipboard
Copied
Hi!
Agupta wrote back with some insight:
In passive mode, the VSCode debugger runs only for the session duration. After that its like no debugger is present. And when the target tries to connect to debugger from “target started debug session”, it performs the default behaviour, which is to launch ESTK and start a debug session.
Hopefully that helps!
Best,
Erin F.
Copy link to clipboard
Copied
Copy link to clipboard
Copied
ErinF yes sberic is correct - I've been working in active mode and still having issues.
I've tried disabling my startup script and just working at getting the debugger to start from code triggered directly by the CEP panel, using a `debugger` statement in the code itself, and have found that to be really unreliable. Even working from a clean restart of the machine, using active mode and debug level set to 2, I when I execute the code in the CEP panel with the debugger statement, VSCode will break, and the toolbar allowing me to step through the code becomes active, but it doesn't show the code and no call stack or variables are visible. I can execute the VSCode command to step through the code, but it doesn't actually show the code.
At this point I've just set the mode to passive and am using ESTK to debug. Which is disappointing, because when the VSCode debugger is working it's far superior, but I can't get it to work.
One thing that's unclear from the documentation is how to start a debug session when the mode is active. Do I have to have InDesign started via VSCode? Does VSCode need to be running? Documentation could definitely be cleaned up there, at least.
Copy link to clipboard
Copied
Completely agreed on your conclusions. It's a bit of a mess right now.
That said, with respect to this:
LSH_246 wrote
Even working from a clean restart of the machine, using active mode and debug level set to 2, I when I execute the code in the CEP panel with the debugger statement, VSCode will break, and the toolbar allowing me to step through the code becomes active, but it doesn't show the code and no call stack or variables are visible. I can execute the VSCode command to step through the code, but it doesn't actually show the code.
Have you tried what I suggested a few posts back? Specifically:
hat happens if you include your "startup" script in your "debug instance" [read: "program"] script? So instead of a "simple alert" in the script you specify in the config, you specify the startup script with something like "//@include 'startupScript.jsx'". You can use standard JavaScript checks to skip re-evaluation (e.g. check for the existence of your EventManagerSimple object before running the declaration code).
The ESD extension may be configured to only be "aware" of files specified in the config or those included by it (which is its own oddity...). Give that a shot, perhaps?
One last-ditch debugging test could be to remove your script from the startup script location, specify it in your config, and launch InDesign with it...
Copy link to clipboard
Copied
sberic I got my results after disabling my event handler code and just working exclusively with functionality in the CEP panel. Your idea of making the startup script be the event handler is clever - I'll try that. But I don't have high hopes, and I have even less time.
The ESD extension may be configured to only be "aware" of files specified in the config or those included by it (which is its own oddity...). Give that a shot, perhaps?
Which configuration is this?
Copy link to clipboard
Copied
LSH_246 wrote
The ESD extension may be configured to only be "aware" of files specified in the config or those included by it (which is its own oddity...). Give that a shot, perhaps?
Which configuration is this?
The launch.json config file. Specifically this is referring to the program property.

Copy link to clipboard
Copied
I just tried a bunch of testing myself and it does, indeed, appear that the ESD in VSCode is only good for "running a JavaScript." It might be useful for testing small-to-medium sections of code, sort of like on-the-fly unit testing, but it's no good for a project of any appreciable length and complexity.
In addition, I am also developing a CEP extension that is going to be a huge project and I would dearly love to use some sort of debugging ability with it, but it seems this is just not possible currently. Shame.
Copy link to clipboard
Copied

Find more inspiration, events, and resources on the new Adobe Community
Explore Now
 AdChoices