• Global community
    • Language:
      • Deutsch
      • English
      • Español
      • Français
      • Português
  • 日本語コミュニティ
    Dedicated community for Japanese speakers
  • 한국 커뮤니티
    Dedicated community for Korean speakers
Exit
1

How to debug a Photoshop CEP extension with VSCode ExtendScript debugger

Community Beginner ,
Aug 12, 2019 Aug 12, 2019

Copy link to clipboard

Copied

I have downloaded Visual Studio Code for Mac, installed the ExtendScript and have used it to debug a few stand-alone .jsx scripts. So far so good. However, I cannot figure out how to debug an extension. I'm using a copy of the PhotoshopEvents CEP panel from the Samples folder (let's call it myPSEvents) and I'm modifying it. My workflow right now is:

  1. Change something in myPSEvents
  2. Switch to Photoshop 2019
  3. Close the myPSEvents panel
  4. Open the myPSEvents panel
  5. Check the results and either go back to step 1 or, if it's a right old mess, go to step 6
  6. Open Chrome, do the localhost:8011 and check their debugger / DOM inspector etc. (my HTML is a bit rusty)


Obviously, I would like to do the debugging in VSCode, but I can't get it to work. I suspect it has to do with the configurations in launch.json.

I have added two folders to my workspace. The first is the standalone scripts folder: ⁨~/Documenten⁩/Adobe Scripts⁩. The launch.json looks like this:


   "configurations": [


  {

   "type": "extendscript-debug",

   "request": "launch",

   "name": "Some tests",

   "program": "${workspaceFolder}/PS_tests.jsx",

   "stopOnEntry": false

  },

This works fine. I can debug the script, set breakpoints, etc.


The second folder in my workspace is the CEP folder: ~Library/⁨Application Support⁩/Adobe⁩/CEP⁩/⁨extensions⁩. It contains myPSEvents, a modified copy of PhotoshopEvents extension. This launch.json looks like this:


"configurations": [


  {

   "type": "extendscript-debug",

   "request": "launch",

   "name": "myPSEvents Panel",

   "program": "${workspaceFolder}/myPSEvents/",

   "stopOnEntry": false

  },

  {

   "type": "extendscript-debug",

   "request": "launch",

   "name": "PhotoshopEvents 'Your first panel'",

   "program": "${workspaceFolder}/PhotoshopEvents/client/index.js",

   "stopOnEntry": false

  },

  {

   "type": "extendscript-debug",

   "request": "launch",

   "name": "PhotoshopEvents Original",

   "program": "${workspaceFolder}/PhotoshopEvents/js/main.js",

   "stopOnEntry": false

  }

  ]


Trying to use these configurations results in various errors:

Configuration PhotoshopEvents 'Your First Panel' (${workspaceFolder}/PhotoshopEvents/client/index.js)


Starting /Users/me/Library/Application Support/Adobe/CEP/extensions/PhotoshopEvents/client/index.js in target: photoshop-130.064 and engine: main.


Runtime Error: Error Code# 22: CSInterface heeft geen constructor @ file '~/Library/Application%20Support/Adobe/CEP/extensions/PhotoshopEvents/client/index.js' [line:2, col:1]


Configuration PhotoshopEvents Original: (${workspaceFolder}/PhotoshopEvents/js/main.js)

  • alert box saying: (#15)Cannot execute script in target engine 'main'!
  • no problems reported in the Problems section of the VSCode console


The same (#15) error I got for the myPSEvents panel configuration, until I shortened the program path to ${workspaceFolder}/myPSEvents/". VSCode then no longer threw errors, but did no debugging either. It does activate Photoshop, but that's it: breakpoints are ignored, an undeclared variable used as parameter, a missing semi-colon at the end of a line of code -- VSCode could not care less.

My question then: is VSCode capable of debugging CEP extensions? If so, what am I doing wrong? If not, could one use it to debug parts of it, say the .js / .jsx communication?

TOPICS
ExtendScript Debugger

Views

11.6K

Translate

Translate

Report

Report
Community guidelines
Be kind and respectful, give credit to the original source of content, and search for duplicates before posting. Learn more
community guidelines

correct answers 1 Correct answer

Community Beginner , Aug 12, 2019 Aug 12, 2019

@sberic "program": "{$workspaceFolder}/PhotoshopEvents/host/ps.jsx" Thanks, that's good to know. It doesn't actually say anywhere what the configuration should point at and when I changed it, VSCode immediately started complaining again it couldn't find host/ps.jsx -- which is why I started experimenting with other configurations. However, when I restarted the whole shebang, and what with having completely uninstalled the ExtendScript Toolkit, something interesting happened:

Schermafbeelding 2019-08-12 om 21.33.42.jpg

That's the first tim

...

Votes

Translate

Translate
Adobe Employee ,
Aug 12, 2019 Aug 12, 2019

Copy link to clipboard

Copied

Hi there!

Have you gone through all the official troubleshooting steps below? (I hate to be didactic, but have to ask.)

The following steps are good standard troubleshooting, as well as troubleshooting "Error #15 Can't initialize target."

  • Make sure the ESTK stand-alone application is closed
  • Close the target application (example: Photoshop)
  • Close Visual Studio Code
  • Make sure there are no VS "Code Helper" processes in the Activity Monitor (Mac) or Task Manager (Windows)
  • Restart Visual Studio Code
  • Does it work then?
  • If not, does a reboot help?

Here are a couple of other things people have tried:

  • Try putting double slashes in your file path (escaping it in a different way)
  • Check which version of VSCode you're running, the plugin doesn't work with old versions.
  • Close the desktop ESTK app.

According to sberic​ "True debugging" may not be possible in the VSCode plugin as it exists today. Additionally, there are two debug modes at the moment, an active mode and a passive mode, so it depends a bit on the debug level you've set.

I have filed at least one bug specific to how the breakpoints are being passed over ( UXP-10381 ).

Give the thread above a read and try out the troubleshooting steps and let me know how it works out.

Votes

Translate

Translate

Report

Report
Community guidelines
Be kind and respectful, give credit to the original source of content, and search for duplicates before posting. Learn more
community guidelines
Community Beginner ,
Aug 12, 2019 Aug 12, 2019

Copy link to clipboard

Copied

@ErinF I've followed all the steps and I've uninstalled ExtendScript Toolkit, both versions, then restarted again. Unfortunately, the problems are still there. But the Activity Monitor (MacOS Mojave) did yield something of interest. When I closed Photoshop and VSCode, there was no trace of Code Helper. But when I started up VSCode (and through VSCode, Photoshop 2019),  Activity Monitor showed a lot of Code Helper instances, including one unresponsive on.

Schermafbeelding 2019-08-12 om 21.05.05.jpg

Votes

Translate

Translate

Report

Report
Community guidelines
Be kind and respectful, give credit to the original source of content, and search for duplicates before posting. Learn more
community guidelines
Community Expert ,
Aug 12, 2019 Aug 12, 2019

Copy link to clipboard

Copied

Try launching your app from the VS Code ExtendScript debugger instead of attaching to an existing process, I've had more luck with that.

Sometimes strict syntax errors can throw ambiguous error messages as well. Try testing with a basic file ("alert(123);" for example) till you get it working and then go from there.

Also, make sure you're debugging our CEP/JS side of your extension in Chrome Dev Tools and only your ExtendScript side in VS Code. I know some people have set up both in VS Code, but keeping it separate is a lot more clear when you're getting stuff set up initially.

Votes

Translate

Translate

Report

Report
Community guidelines
Be kind and respectful, give credit to the original source of content, and search for duplicates before posting. Learn more
community guidelines
Community Beginner ,
Aug 12, 2019 Aug 12, 2019

Copy link to clipboard

Copied

@justintaylor "Also, make sure you're debugging our CEP/JS side of your extension in Chrome Dev Tools and only your ExtendScript side in VS Code. I know some people have set up both in VS Code, but keeping it separate is a lot more clear when you're getting stuff set up initially." Uhm, I'm not sure what you mean. I've added the extensions folder to the workspace, that includes the .html and .js code. As for debugging in Chrome, no idea how that thing works either. Is there any way I could do this in Xcode?

Votes

Translate

Translate

Report

Report
Community guidelines
Be kind and respectful, give credit to the original source of content, and search for duplicates before posting. Learn more
community guidelines
Community Expert ,
Aug 12, 2019 Aug 12, 2019

Copy link to clipboard

Copied

Nope, don't use Xcode, Chrome Dev tools come with CEP panels since they're essentially Chrome browsers (built off of the CEF framework).

You need to enable playerDebugMode, create a .debug file with a port for your panel, and then restart your app and launch your panel, then navigate to that port in Chrome with localhost:8000 (or whatever port # you picked).

Follow the cookbook and look at the examples for more details on each of these steps.

Votes

Translate

Translate

Report

Report
Community guidelines
Be kind and respectful, give credit to the original source of content, and search for duplicates before posting. Learn more
community guidelines
Community Beginner ,
Aug 12, 2019 Aug 12, 2019

Copy link to clipboard

Copied

@justintaylor Thanks, I did all that. And I can get to localhost: thing (once I figured out that the panel needs to be active, and it needs to be the first panel too, not the second one). But then there's only a pause button. I can set a breakpoint in main.js, but it never breaks. There's console that says "top" but it never shows anything else. I'll figure it out at some point, but it's reminded me why I gave up on web development.

Votes

Translate

Translate

Report

Report
Community guidelines
Be kind and respectful, give credit to the original source of content, and search for duplicates before posting. Learn more
community guidelines
Community Expert ,
Aug 12, 2019 Aug 12, 2019

Copy link to clipboard

Copied

Yep, Software Development is not for the faint of heart .  If you're having trouble with the Chrome Dev Tools console in your browser, install the CEF client and access your localhost port that way:
CEP-Resources/CEP_9.x at master · Adobe-CEP/CEP-Resources · GitHub

Votes

Translate

Translate

Report

Report
Community guidelines
Be kind and respectful, give credit to the original source of content, and search for duplicates before posting. Learn more
community guidelines
Enthusiast ,
Aug 12, 2019 Aug 12, 2019

Copy link to clipboard

Copied

e.v72938608​ First off, your confusion/frustration is not your fault. The current version of the VSCode ExtendScript Debugger (ESD) was not built with CEP extensions in mind. That said, it is possible to get limited CEP extension debugging, provided you follow a very specific setup.

Specifically, the ESD was built to target a simple ExtendScript script that you send to a host application (e.g. Photoshop) to run and complete. This sounds like what your first PS_test.jsx script is (and likely explains why it works okay). However, your second project appears to be based off of the PhotoshopEvents CEP Sample project. The debugging experience here is "asynchronous" insofar as the code you wish to debug isn't triggered when you hit "Start Debugging" but sometime later when you cause the code to run via some interaction with the panel. This thread outlines how the ESD is implemented [at a high level] and outlines how you can get it to cooperate with such a workflow to a limited extent.

However! Part of your problem is that your three configurations are not pointed at ExtendScript files, but one folder and two JavaScript files. The ESD cannot be used for JavaScript debugging. For that you will either need the cefclient (available here) or a Chrome browser with the correct localhost configuration. The PProPanel sample has good instructions for setting up the HTML/JavaScript-side debugging experience.

That said, the Chrome/cefclient debugging cannot target ExtendScript (.jsx) files. That is what the ESD is for. To that end, you have to specify an ExtendScript file in the launch configuration's "program" field. For the default PhotoshopEvents CEP panel, this would look like:

"program": "{$workspaceFolder}/PhotoshopEvents/host/ps.jsx",

The main takeaway here is that you need to target the correct scripts with the correct debugger:

  1. JavaScript: Chrome or cefclient
  2. ExtendScript: VSCode ExtendScript Debugger (ESD) or ExtendScript Toolkit (ESTK)

Unfortunately, due to the current architecture/implementation of the ESD it is not possible to set up a Compound Launch Configuration in VSCode to get a full debugging experience.

Votes

Translate

Translate

Report

Report
Community guidelines
Be kind and respectful, give credit to the original source of content, and search for duplicates before posting. Learn more
community guidelines
Community Beginner ,
Aug 12, 2019 Aug 12, 2019

Copy link to clipboard

Copied

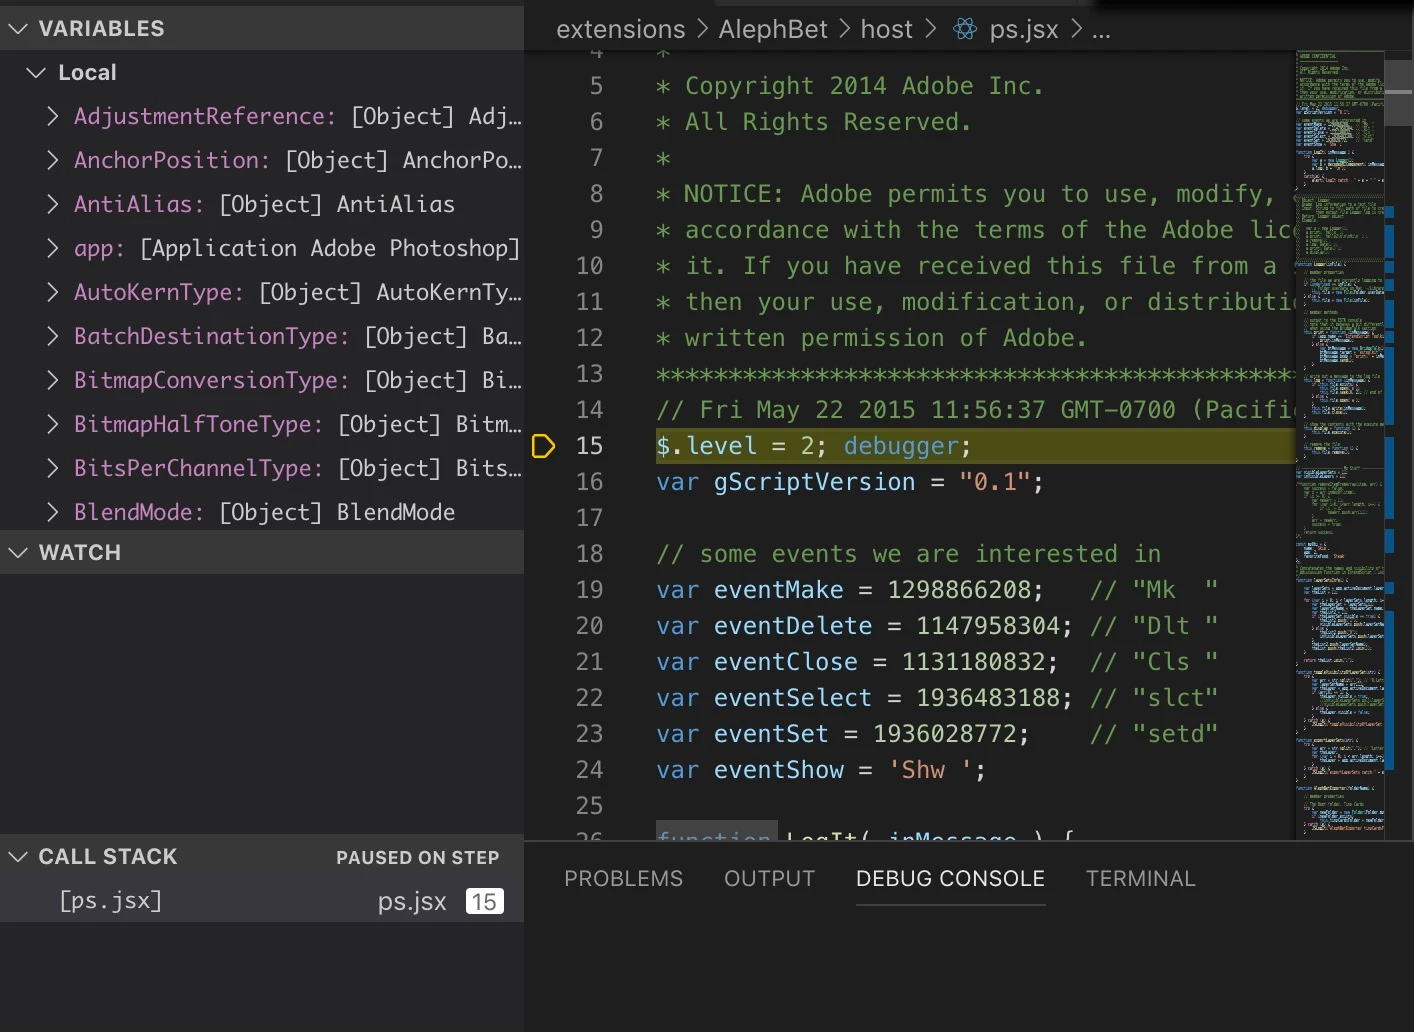
@sberic "program": "{$workspaceFolder}/PhotoshopEvents/host/ps.jsx" Thanks, that's good to know. It doesn't actually say anywhere what the configuration should point at and when I changed it, VSCode immediately started complaining again it couldn't find host/ps.jsx -- which is why I started experimenting with other configurations. However, when I restarted the whole shebang, and what with having completely uninstalled the ExtendScript Toolkit, something interesting happened:

Schermafbeelding 2019-08-12 om 21.33.42.jpg

That's the first time I've seen a variable in the debugger. Anyway, it seems there's an issue now with the debugging level -- a line I inherited from PhotoshopEvents.

Votes

Translate

Translate

Report

Report
Community guidelines
Be kind and respectful, give credit to the original source of content, and search for duplicates before posting. Learn more
community guidelines
Enthusiast ,
Aug 12, 2019 Aug 12, 2019

Copy link to clipboard

Copied

e.v72938608​ The following line:

$.level = 2; debugger;

is a compressed version of this:

$.level = 2;  // Puts this ExtendScript "Engine" into Full Debug Mode.

debugger;     // Causes an attached/listening debugger to pause on this line.

The level property of the Dollar ($) object adjusts the current debugging level. A value of 2 means "full debug mode".

The debugger statement triggers the debugger.

It is important to recall that ExtendScript is a highly customized version of ECMAScript 3 (a spec from which older JavaScript versions are also derived). The debugger statement is just one of those pieces of the ExtendScript language that is shared with [older] JavaScript.

You can remove that line (or those lines as shown above) without any issue. That is simply there to drop you into a debug session if ESTK is configured (or if you have ESD setup in juuuuuust the right way).

Votes

Translate

Translate

Report

Report
Community guidelines
Be kind and respectful, give credit to the original source of content, and search for duplicates before posting. Learn more
community guidelines
Community Beginner ,
Aug 13, 2019 Aug 13, 2019

Copy link to clipboard

Copied

@e.v72938608 O Ok, that confirms my experience: it's just the debugger chiming in, and the yellow thing is not a warning but the cursor.

@erinF I did follow your Client-side Debugging guide, that's how I got the Chrome / localhost working in the end, but I think the problem is that you're talking about the Chromium Dev Tools, not Chrome. I only spotted this last night -- being rather Mac-oriented I didn't realise Chromium and Chrome are two separate things. However, from what I've read using Chromium is a rather risky proposition and I prefer to err on the side of stability where my developer tools are concerned. So I think I'll stick to Chrome  (using Versie 76.0.3809.100 at present).

@justingtaylor CEP resources -- similar issue. You've been very helpful and I don't wish to offend but CEP-Resources on GitHub has 143 open issues, dating back to 2014. I've looked through some of these issues and, well, I didn't get the impression they receive much TLC. That's a red flag for me, nowadays.

All-in-all, the response to my question has been heart-warming. I get on much better with VSCode now, especially when I found the Zen mode. It's not the full debugging experience, but that was never promised either. VSCode is spotting ExtendScript (and Javascript) errors and I'm finally getting somewhere with my panel, so thanks to everyone.

Votes

Translate

Translate

Report

Report
Community guidelines
Be kind and respectful, give credit to the original source of content, and search for duplicates before posting. Learn more
community guidelines
Enthusiast ,
Aug 13, 2019 Aug 13, 2019

Copy link to clipboard

Copied

e.v72938608  wrote

I think the problem is that you're talking about the Chromium Dev Tools, not Chrome.

No. She's talking about the Chrome DevTools​. They happen to be the same thing in both the Chrome browser and the Chromium browser. The Chromium browser is the fully open-source browser version of the Google-branded Chrome browser. Effectively, Chrome is just Chromium+Google.

The reason you use the Chrome DevTools for CEP development is because the panels themselves have a version of Chromium built in: the Chromium Embedded Framework (CEF). [It's actually unclear if this is truly the case anymore as NW.js appears to have moved away from CEF and towards a direct Chromium integration... but I digress.] Regardless of the integration approach, the engine itself is Chromium and it supports the Chrome DevTools protocols. This means that you can debug a CEP panel with any application that supports the Chrome Debugger Protocol. This includes (but is not limited to) the following:

  1. Chrome Browser
  2. Chromium Browser
  3. cefclient
  4. Visual Studio Code​

You are free to use your Chrome browser to debug. Most people do, actually. If you ever see things in the DevTools window not working as expected, this may be due to the fact that your browser has a newer version of the Chrome Debug Protocol than the panel itself. This is why Adobe releases the cefclient: it's a version-matched, debug tools-only version of Chrome (likely more specifically CEF).

e.v72938608  wrote

CEP-Resources on GitHub has 143 open issues, dating back to 2014. I've looked through some of these issues and, well, I didn't get the impression they receive much TLC. That's a red flag for me, nowadays.

What you need to understand about the Adobe and GitHub is that Adobe does not use GitHub for development! It is simply a repository for them to place helpful resources and guides for us developers to access and use without having to navigate their ever-changing website. They seem to use the Issues as a place to source bugs. Any actual issue they verify gets added to their own internal bug tracker and we are lucky if we ever hear about any fixes/changes whatsoever. The point here is simply that Adobe uses the GitHub repos very differently from most companies and mapping your standard approach to it may not work out as you expect.

The CEP-Resources page is effectively a resource delivery, documentation, and bug-reporting site. Just about zero actual development occurs there.

e.v72938608  wrote

All-in-all, the response to my question has been heart-warming. I get on much better with VSCode now, especially when I found the Zen mode. It's not the full debugging experience, but that was never promised either. VSCode is spotting ExtendScript (and Javascript) errors and I'm finally getting somewhere with my panel, so thanks to everyone.

(^_^)b

Votes

Translate

Translate

Report

Report
Community guidelines
Be kind and respectful, give credit to the original source of content, and search for duplicates before posting. Learn more
community guidelines
Community Expert ,
Aug 13, 2019 Aug 13, 2019

Copy link to clipboard

Copied

@justingtaylor CEP resources -- similar issue. You've been very helpful and I don't wish to offend but CEP-Resources on GitHub has 143 open issues, dating back to 2014. I've looked through some of these issues and, well, I didn't get the impression they receive much TLC. That's a red flag for me, nowadays.

No offense taken, I didn't build the project , but yes those issues don't reflect the current state of CEP panels as sberic​ described.

Really sberic​ put it best, but just to clarify terms:

Chrome: Browser by Google

Chromium: Open source browser platform by Google
CEF (Chromium Embedded Framework): Chromium framework used by lots of dev projects

CEP (Common Extensibility Platform): Adobe's integration of CEF framework for use in Adobe CC apps

Chrome Dev Tools: Tools for debugging that come with all versions of Chrome and Chromium.

CEF Client: A Chrome Browser for each version of CEP that should be used when debugging each particular version of CEP panels to avoid version clashes.

Common Extensibility Platform

Votes

Translate

Translate

Report

Report
Community guidelines
Be kind and respectful, give credit to the original source of content, and search for duplicates before posting. Learn more
community guidelines
Adobe Employee ,
Aug 13, 2019 Aug 13, 2019

Copy link to clipboard

Copied

e.v72938608  wrote


@justingtaylor CEP resources -- similar issue. You've been very helpful and I don't wish to offend but CEP-Resources on GitHub has 143 open issues, dating back to 2014. I've looked through some of these issues and, well, I didn't get the impression they receive much TLC. That's a red flag for me, nowadays.

So, sberic​ is probably correct above, in that Adobe is not using that public github instance the way other companies do. Putting the CEP Cookbook on github in the first place was, I believe, an attempt to offer it in some format other than a .pdf, as had been done previously.

My colleagues and I on our small Developer Experience team have been trying to close some of the 143 open issues in that repo, when we can, between launches that take away our attention...

I'm glad you've been able to get more help in this thread! I know the plugin's documentation needs more work, and this discussion has been really helpful pointing in the right direction.

Votes

Translate

Translate

Report

Report
Community guidelines
Be kind and respectful, give credit to the original source of content, and search for duplicates before posting. Learn more
community guidelines
Contributor ,
May 08, 2020 May 08, 2020

Copy link to clipboard

Copied

Hi,


I am just trying to create my first CEP panel (for illustrator), but I cannot get ESTK to debug my jsx file.

I tried to add the

$.level = 2; debugger;

but nothing happens when I open my panel and click the button there.

The scripts currently lokk like this:

#target illustrator-24

var saved = {}; // global data for the script
function myfunc() {
   ....
   return results.toSource();
}

and

function clicked() {
  csInterface.evalScript('myscript()', function(result) {
    alert(result);
  });
}

Is there any documentation on how to set things up?

I do not need client debugging yet.

Votes

Translate

Translate

Report

Report
Community guidelines
Be kind and respectful, give credit to the original source of content, and search for duplicates before posting. Learn more
community guidelines
Adobe Employee ,
Aug 12, 2019 Aug 12, 2019

Copy link to clipboard

Copied

I need to pipe in here to mention the Chrome debugging tutorial I wrote last year.

Votes

Translate

Translate

Report

Report
Community guidelines
Be kind and respectful, give credit to the original source of content, and search for duplicates before posting. Learn more
community guidelines
Community Beginner ,
Oct 26, 2020 Oct 26, 2020

Copy link to clipboard

Copied

LATEST

@sberic One of the most respectful, understandable and thorough replies I've read on a community forum in quite some time. Props to you sir.

~ you’re never too old for a happy childhood

Votes

Translate

Translate

Report

Report
Community guidelines
Be kind and respectful, give credit to the original source of content, and search for duplicates before posting. Learn more
community guidelines