


Copy link to clipboard
Copied
I have a rather complicated dialogue and want to use the step-by-step walk-through to check variables etc.
As soon as I press a button in the dialogue the related code in the callback routine is run - no chance for step-by-step operation:
- Set a breakpoint at the beginning of the callback routine
- Have a breakpoint close to the end of the dialogue-setup code
- Tip-toe further (F11) until dialog is presented
- Click button
- I now expect the execution halts at the brakpoint within the callback routine, but this is not done.
- I know, that i'm in this routine, because an alert is performed if present.
- But after the alert theres is no chance to use stepping (F11).
Is this as designed?
To illustrate: this is the dialgue
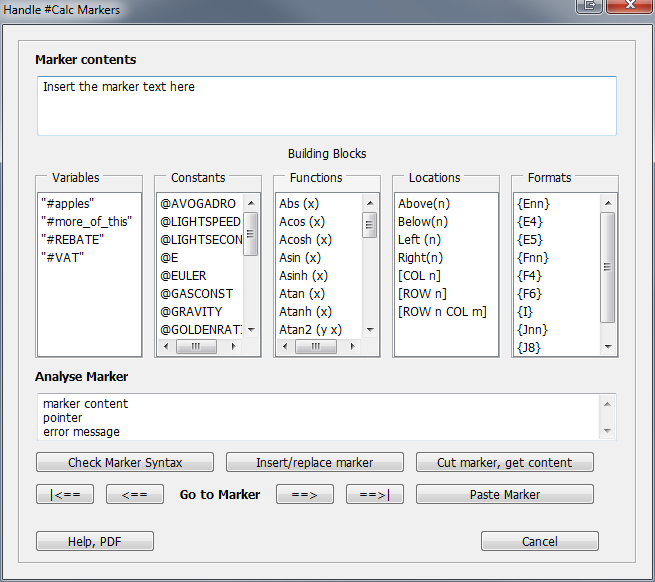
and this is the callback routine for the button ==> (next)
I have set a breakpoint at line 2 which is not used at all.
win.p0.g3.btnNext.onClick = function () {
      goCurrentMarker= GetMarker (oDoc, sMarkerName, "next", goCurrentMarker) ;
      win.p0.sMarkerContent.text ="";
      gsMarkerText = goCurrentMarker.MarkerText;
      win.p0.sMarkerContent.textselection = gsMarkerText;
    }
Yes, I test routines (e.g. GetMarker) ins separate text-scripts (see my other post of today), but the dialogue is different environment and hence must be tested again (as I have learnt).
Do you have any ideas how to debug dialogues whithout placing numerous alert/console statements?
Klaus Daube


 1 Correct answer
Although knowing the $.bp (true); statement I did not realise that ESTK does not get control...
win.p0.g3.btnNext.onClick = function () {
      $.bp (true);
      goCurrentMarker= GetMarker (oDoc, sMarkerName, "next", goCurrentMarker) ;
      win.p0.sMarkerContent.text ="";
      gsMarkerText = goCurrentMarker.MarkerText;
      win.p0.sMarkerContent.textselection = gsMarkerText;}
I thought that the script is run in the environment of ESTK (even with #target framemaker) while debugging.
But this is not
... 1
Reply
1
1
Reply
1
Copy link to clipboard
Copied
Although knowing the $.bp (true); statement I did not realise that ESTK does not get control...
win.p0.g3.btnNext.onClick = function () {
      $.bp (true);
      goCurrentMarker= GetMarker (oDoc, sMarkerName, "next", goCurrentMarker) ;
      win.p0.sMarkerContent.text ="";
      gsMarkerText = goCurrentMarker.MarkerText;
      win.p0.sMarkerContent.textselection = gsMarkerText;}
I thought that the script is run in the environment of ESTK (even with #target framemaker) while debugging.
But this is not true.
- Hence after inserting the $.bp (true); statement
- I must save the script,
- Run it (F5)
- The dialog appears and i click on the button
- In ESTK the line with the breakpoint is highlighted
- And I can step further
I did not get this awareness from the JavaScript Tools Guide (which IMHO should be titles ExtendScript ...) but from experiments. The ralationship between the target enginge (framemaker) and ESTK is still a mystery for me. The wording "target engine" does not appear in the JS Tools Guide! It is called JavaScript engine.
Maybe my method of thinking is not up to date anymore...

 AdChoices