- Home
- Illustrator
- Discussions
- donut chart in illustrator >with curved ends
- donut chart in illustrator >with curved ends
donut chart in illustrator >with curved ends
Copy link to clipboard
Copied
Hi everyone, Im wondering how this can be done. I need to create a donut chart in illustrator, which has a curved end and start as below. Hopefully this can be edited to reflect the percentages if change. I can get the basic chart information using a gradient start or stop with the desired colours, or use a brush to follow the path, bu was wondering tif there is another way?
thanks

Explore related tutorials & articles
Copy link to clipboard
Copied
Lister,
You can use stroke/nofill paths with Round Caps and split the green one in two, then set a stacking order with (from the bottom) the green hollow end, the whole blue, the whole red, and the green round/front end.
And then gradients across the stroke with sharp transition (two stops on top of each other at 50%).
Copy link to clipboard
Copied
How do I break apart the percentage amount?
Copy link to clipboard
Copied
This is a good tutorial that shows how to make a donut chart and preserve the data so that it can be changed and updated later. How To Make a Donut/Doughnut Chart in Illustrator Keeping Data Live - YouTube
However, that does not give you round caps. Once everything is final, you'll need to draw the paths as Jacob Bugge described. Make a copy of the "live" graph before doing that so that you can edit the data if it happens to change later.
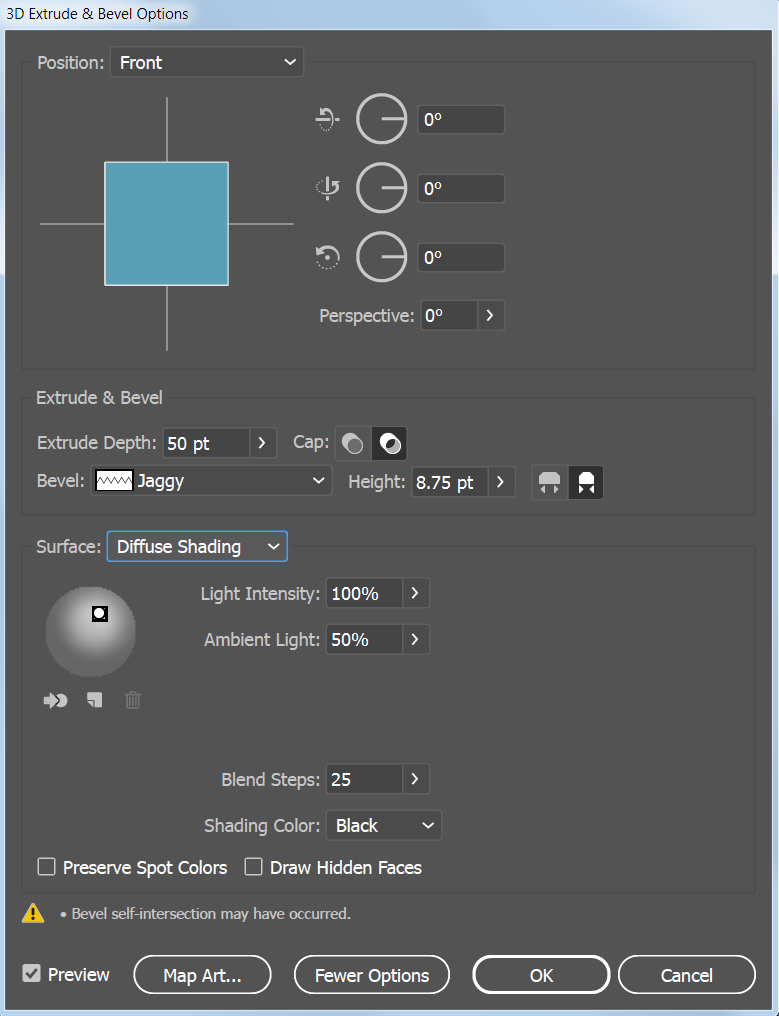
By the way, I was able to get a raised look using these settings on the clipping mask, but not the rounded caps.


Get ready! An upgraded Adobe Community experience is coming in January.
Learn more