• Global community
    • Language:
      • Deutsch
      • English
      • Español
      • Français
      • Português
  • 日本語コミュニティ
    Dedicated community for Japanese speakers
  • 한국 커뮤니티
    Dedicated community for Korean speakers
Exit
0

Graphs in Illustrator (limited default colours?)

Participant ,
Feb 06, 2019 Feb 06, 2019

Copy link to clipboard

Copied

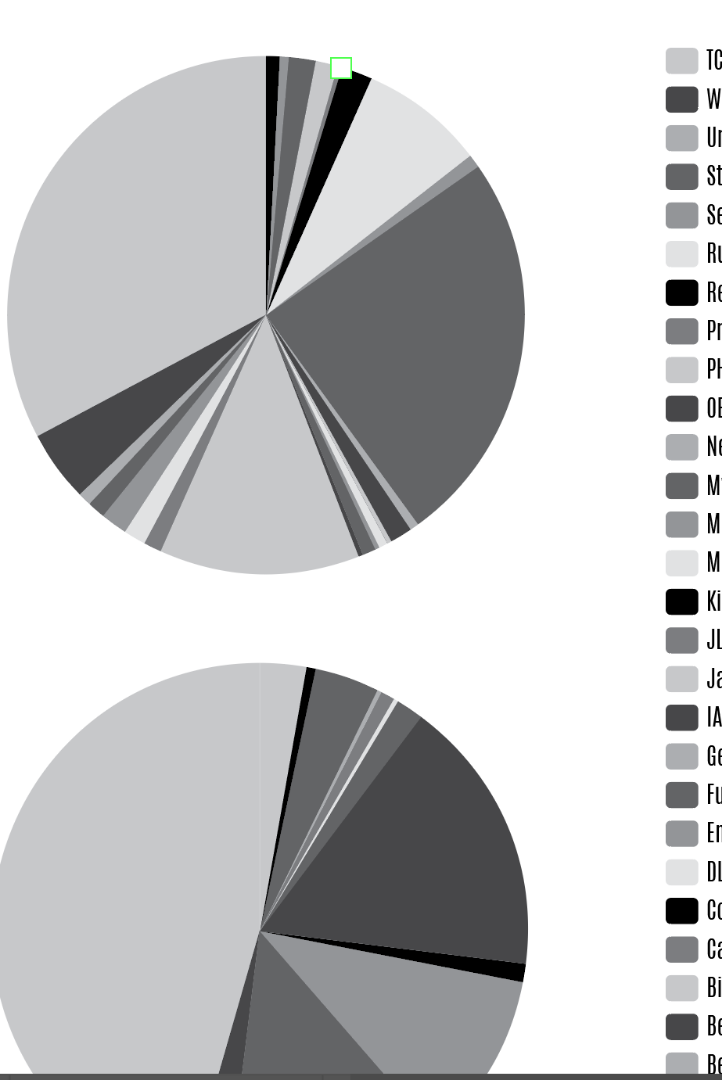
Hi, I'm making some pretty nice graphs using imported data in Illustrator but, when I have more than 9 bars, I find the default greyscale colours are limited to just 9 shades.

This means that (as I believe we have no colour options available within the Graph Tool dialogue) I have a hard time of it re-colouring the generated bars.

With a lot of bars and pie-segments to recolour I just don't know what's what- the same shade of grey is used for 4 different clients in my graph.

Is there something in the dialogues I'm overlooking or is AI limited to just 9 shades of grey?

Views

3.4K

Translate

Translate

Report

Report
Community guidelines
Be kind and respectful, give credit to the original source of content, and search for duplicates before posting. Learn more
community guidelines

correct answers 1 Correct answer

Community Expert , Feb 06, 2019 Feb 06, 2019

Hi,

The graphing tools in Illustrator are archaic. They have not been changed since Illustrator 6 (not CS6).

The tool you want to use is the Group Selection tool to change the colors. Click once to select the first item in the group, then again, etc. Experiment. In a graph, start by click the icon in the legend to be more efficient, then change the color.

But if you really want to learn how to make this very old technology up to date, you absolutely must watch tonyharmer’s series on LinkedIn Learni

...

Votes

Translate

Translate
Adobe
Community Expert ,
Feb 06, 2019 Feb 06, 2019

Copy link to clipboard

Copied

Hi,

The graphing tools in Illustrator are archaic. They have not been changed since Illustrator 6 (not CS6).

The tool you want to use is the Group Selection tool to change the colors. Click once to select the first item in the group, then again, etc. Experiment. In a graph, start by click the icon in the legend to be more efficient, then change the color.

But if you really want to learn how to make this very old technology up to date, you absolutely must watch tonyharmer’s series on LinkedIn Learning. You will be wowed!

Creating Infographics with Illustrator

~ Jane

Votes

Translate

Translate

Report

Report
Community guidelines
Be kind and respectful, give credit to the original source of content, and search for duplicates before posting. Learn more
community guidelines
Participant ,
Feb 06, 2019 Feb 06, 2019

Copy link to clipboard

Copied

Thank you so much jane-e, I'll just do it in Word as, remarkable, the results are very similar and it's more modern and user-friendly in this regard.
I will watch that series over lunch today though, Thanks

Votes

Translate

Translate

Report

Report
Community guidelines
Be kind and respectful, give credit to the original source of content, and search for duplicates before posting. Learn more
community guidelines
Community Expert ,
Feb 06, 2019 Feb 06, 2019

Copy link to clipboard

Copied

LATEST

I had pretty well given up on graphs in Illustrator until I had the opportunity to be a teaching assistant for Tony last year at Adobe MAX and saw what he was doing with them. Now I’m back and having fun!

~ Jane

Votes

Translate

Translate

Report

Report
Community guidelines
Be kind and respectful, give credit to the original source of content, and search for duplicates before posting. Learn more
community guidelines