
질문
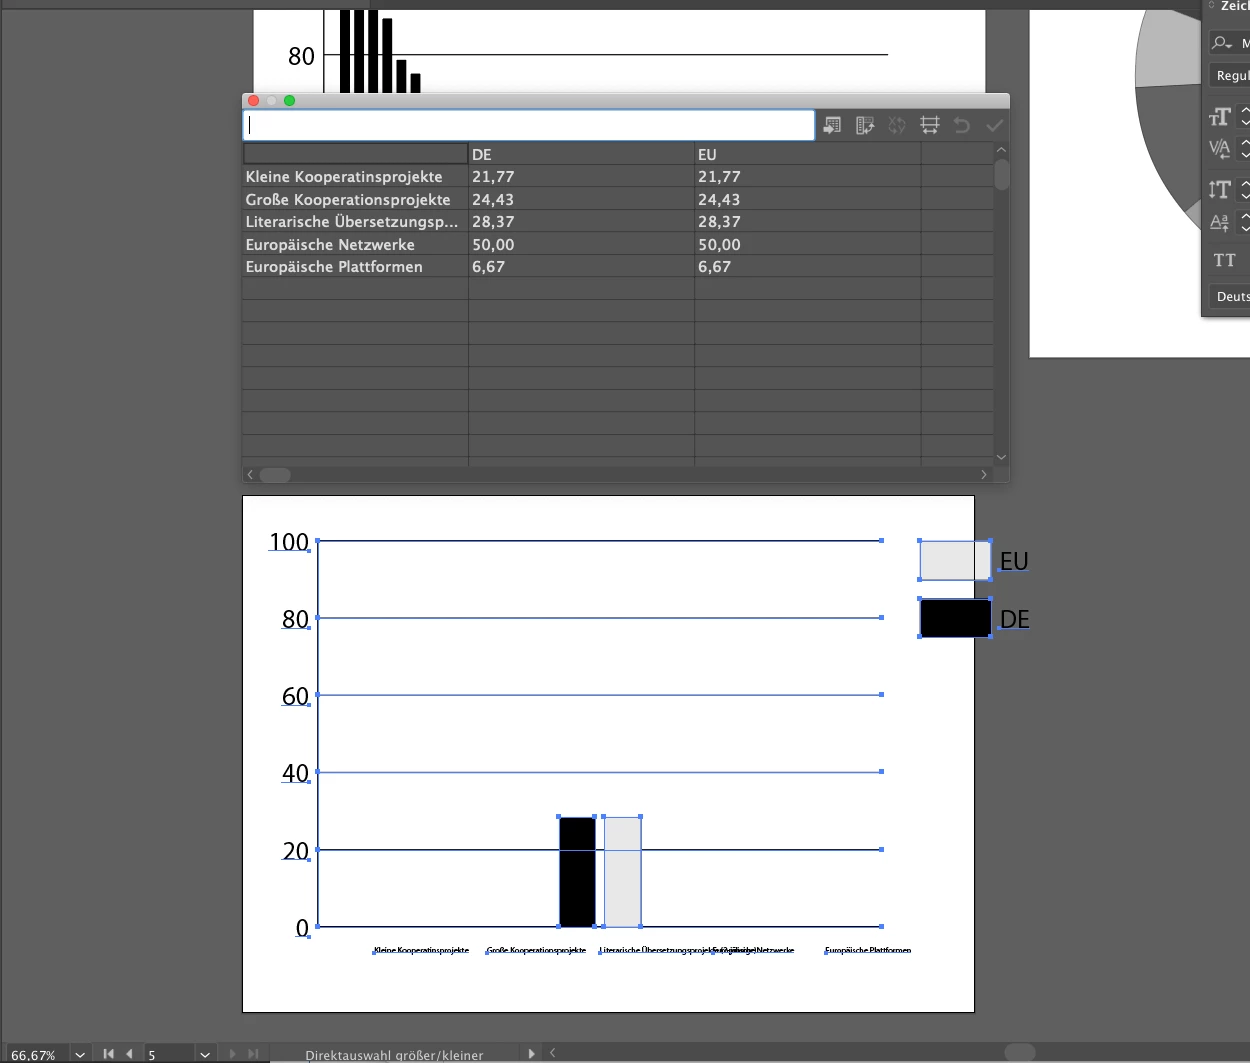
vertical column diagram with two values /// Infographic
Hi there
I am quite new to the diagram tool and want to create a vertikal column graph with two numbers for one aspect/category. These should be two columns next to each other each time. But unfortunatly instead of 5 tmes two columns its visible only on time.
I wold be thankful about any advice.