Known Participant
April 19, 2023
Answered

Expose One of the Float4 Parameters

  • April 19, 2023
  • 1 reply
  • 895 views

Hi 
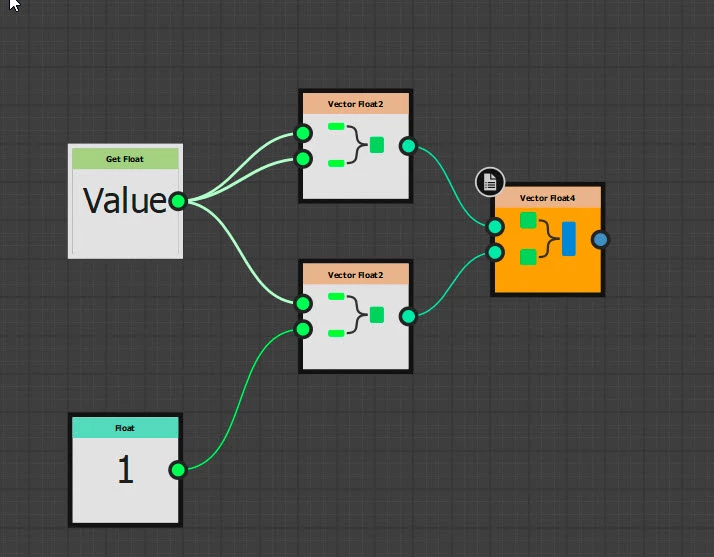
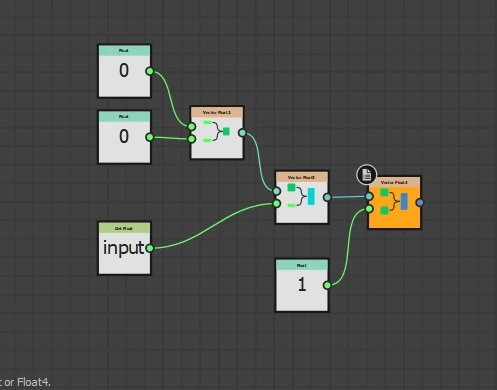
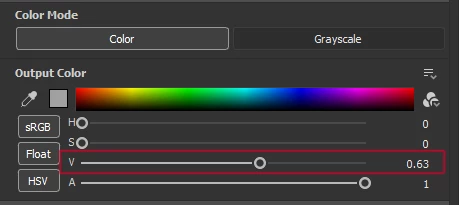
I'm trying to expose the value parameter (lightness) as a float1 from a color node that is represented as a float4. as you see, I attempted to break down the color node into vector float nodes , but it didn't work as I expected. Can you please help me with this issue?

This topic has been closed for replies.
Correct answer davescm

I hadn't spotted that, I should have tested better 😞


It would appear that the node works in RGBA when driven by a function, even when set to Float and HSV before adding the function.

So the function graph needs to be as below to give your required output.


Dave


1 reply

davescm
Community Manager
Community Manager
April 19, 2023

Like this ?

I added an input to the graph which I labelled Value then used a Get Float to get that value and then two Vector Float 2 nodes and a Vector Float 4 to combine it with the other fixed Float values


SBS also attached


Dave


Known Participant
April 20, 2023

Thanks Dave 

Due to technical reasons, I have to use color node with it's Color mode ( not Grayscale) to determine the mettalic value of the material.
After using the functions that you provided, I expected the color to become desaturated because the saturation value is 0. But, the color is still blue.

My main goal is to make the Color node with Color mode behave like the Grayscale mode and expose the Value parameter. This way, when the color is blue, the defined parameter can't reach a fully white value (255).
Can you suggest a solution for this issue?

I hope I was able to explain my problem clearly. let me know if you need more information.

davescm
Community Manager
davescmCommunity ManagerCorrect answer
Community Manager
April 20, 2023

I hadn't spotted that, I should have tested better 😞


It would appear that the node works in RGBA when driven by a function, even when set to Float and HSV before adding the function.

So the function graph needs to be as below to give your required output.


Dave