


Frequency Analysis bottom table still shows full floating-point values v26.5
In Audition v26.0, the Frequency Analysis scan results (Channel 1 / Channel 2 / Average) displayed frequency and amplitude values with fixed 2‑decimal precision. This made the data easy to read and compare, especially when calculating channel differences or EQ adjustments.
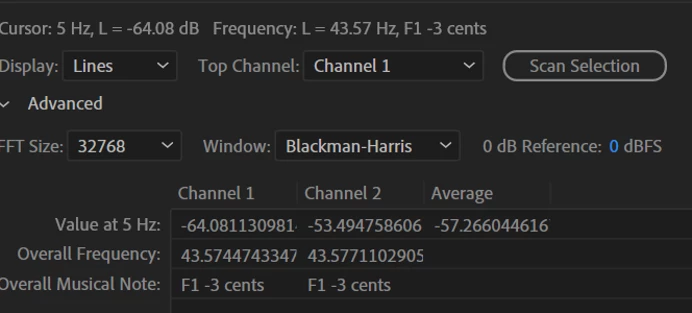
Starting in v26.3, the bottom portion of the Frequency Analysis panel began showing full floating‑point numbers (e.g., 43.5744743347 Hz). This is a regression from v26.0.
In v26.5, Adobe fixed the top readout so it’s rounded again, but the bottom table is still unfixed and continues to output raw float values. This makes the scan results inconsistent and much harder to use for workflows that rely on stable, fixed‑precision numbers.
Request: Please apply the same rounding/formatting fix used for the top readout to the bottom table of the Frequency Analysis scan results, restoring the v26.0 behavior (2‑decimal precision).
Thanks for looking into this — it’s a small UI detail, but it has a big impact on analysis workflows.

 AdChoices