Participant
November 8, 2025

P: Crash on use of AI Settings (11562305) (11564853)

  • November 8, 2025
  • 3 replies
  • 150 views

  1. Version of the app:
    Adobe Lightroom Classic 15.0 (Build 15.0)

  2. Platform and OS version:

    • Platform: Mac mini (Apple M1)

    • OS: macOS 26.1 (Build 25B78)

  3. Core Application/Hardware Details:

    • Application Architecture: arm64

    • Logical processor count: 8

    • Built-in/Real memory: 8,192.0 MB

    • Dedicated GPU memory: 104.9MB used / 5,461.3MB max

    • Core Technology: CameraRaw (v18.0), AgKernel, AgSubstrate, Chromium Embedded Framework, libadobe_c2pa.dylib.

    • Key Configuration: Catalog file resides on an external SSD (/Volumes/2030/...).

    • AI/GPU Usage: GPU for Image Processing supported by default, but User Preference: Off, GPU for Preview Generation: Off(S3_5).

  1. Basic steps to reproduce the problem:
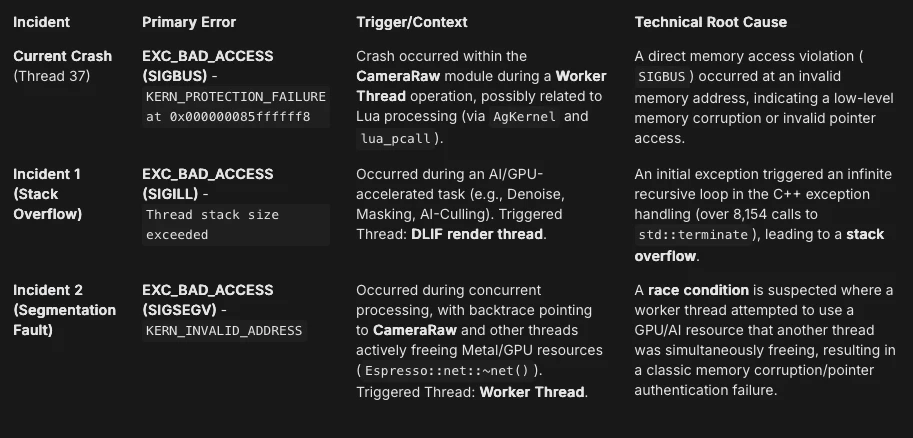
    AI Culling is the culprit each time, a tiny bulk of images under 3,000 will crash every single time.

  2. Expected result:
    The AI task (Denoise, Lens Blur, etc.) should complete successfully, and Lightroom should remain stable.

  3. Actual result:
    The application freezes and crashes (multiple distinct crash patterns observed related to AI/GPU processing).

  4. Full Crash Log: Attached (Data from previous step included above)

Lightroom Classic version: 15.0 [ 202510171722-44f87028 ]
License: Creative Cloud
Language setting: en-US
Operating system: Mac OS 26
Version: 26.1.0 [25B78]
Application architecture: arm64
Logical processor count: 8
Processor speed: NA
SqLite Version: 3.36.0
Built-in memory: 8,192.0 MB
Dedicated GPU memory used by Lightroom: 104.9MB / 5,461.3MB (1%)
Real memory available to Lightroom: 8,192.0 MB
Real memory used by Lightroom: 170.2 MB (2.0%)
Virtual memory used by Lightroom: 427,161.3 MB
Memory cache size: 278.3MB
Internal Camera Raw version: 18.0 [ 2389 ]
Maximum thread count used by Camera Raw: 5
Camera Raw SIMD optimization: SSE2
Camera Raw virtual memory: 35MB / 4095MB (0%)
Camera Raw real memory: 36MB / 8192MB (0%)

Cache1:
NT- RAM:0.0MB, VRAM:0.0MB, Combined:0.0MB

Cache2:
m:278.3MB, n:0.0MB

U-main: 195.0MB

Standard Preview Size: 3840 pixels
Displays: 1) 3840x2160

Graphics Processor Info:
Metal: Apple M1
Init State: GPU for Image Processing supported by default
User Preference: Off
Enable HDR in Library: OFF
GPU for Preview Generation: Off (S3_5)

Application folder: /Applications/Adobe Lightroom Classic
Library Path: /Volumes/2030/EXTRACTO_THE_MAGNIFICO/EXTRACTO_THE_MAGNIFICO.lrcat
Settings Folder: [USER_HOME]/Library/Application Support/Adobe/Lightroom

Installed Plugins:
1) AdobeStock
2) jf Bag-o-Goodies
3) jf Collection Publisher
4) jf Data Explorer
5) jf Metadata Viewer
6) jf Tumblr
7) ON1 Resize AI 2026
😎 Pic-Time
9) Shuffles

Config.lua flags:

3 replies

Rikk Flohr_Photography
Community Manager
Community Manager
November 12, 2025

This crasher was fixed in 15.0.1. Please download the latest build from your Creative Cloud app. 

Rikk Flohr: Adobe Photography Org
Rikk Flohr_Photography
Community Manager
Community Manager
November 9, 2025

I've located your crash report. Thank you for submitting. 

I've opened an investigatory ticket with the Classic team. 

Rikk Flohr: Adobe Photography Org
mackmeAuthor
Participant
November 8, 2025

1. Version of the app Adobe Lightroom Classic 15.0 (Build 15.0)

2. Platform and OS version

  • Platform: Mac mini M1 (Macmini9,1)

  • OS: macOS 26.1 (Build 25B78) "Tahoe"

3. Basic steps to reproduce the problem Ai Culling is the culprit each time, a tiny bulk of images under 3,000 will crash every single time.  

4. Expected result and actual result

  • Expected result: The AI task (Denoise, Lens Blur, etc.) should complete successfully, and Lightroom should remain stable.

  • Actual result: The application enters an infinite recursive loop (over 8,154 calls to std::terminate), causing a stack overflow. The entire application freezes and crashes.

Full Crash Log: attached 

Incident 1: Stack Overflow Crash (LR-ERROR-110825A.txt)

  • Primary Error: EXC_BAD_ACCESS (SIGILL) with an Exception Message: Thread stack size exceeded due to excessive recursion.

  • Triggered Thread: Thread 64, labeled DLIF render thread.

  • Technical Root Cause: The crash occurred due to an infinitely recurring loop within the program's low-level C++ exception handling (libc++abi.dylib, std::terminate(), __cxa_throw). When an initial exception occurred (likely within the rendering pipeline, possibly in CoreML/MPSGraph code), the program tried to handle or terminate it, which recursively called the termination routine over 8,154 times, consuming all stack memory and triggering a kernel protection failure (KERN_PROTECTION_FAILURE).

  • Context: The involved frameworks (CoreML, Espresso, MetalPerformanceShadersGraph) confirm the initial event was triggered during an AI/GPU-accelerated task (such as Denoise, Masking, or AI-Culling/Face Detection). This recursive crash pattern often means a severe logic flaw in the library's cleanup or error-handling code when running accelerated tasks.

Incident 2: Segmentation Fault Crash (LR-ERROR-110825B.txt)

  • Primary Error: EXC_BAD_ACCESS (SIGSEGV) with an Exception Subtype: KERN_INVALID_ADDRESS at 0xcc3a15b89210fa4c (possible pointer authentication failure).

  • Triggered Thread: Thread 111, labeled Worker Thread.

  • Technical Root Cause: This is a classic memory corruption error (Segmentation Fault). The thread tried to read or write data at an invalid, unmapped memory address (0xcc3a...). The address being a high, non-canonical address (0xcc3a...) that results in a Pointer Authentication failure (possible pointer authentication failure on ARM-64) points to a serious pointer corruption or an incorrect memory access during concurrent work.

  • Context: The backtrace shows the crash originating deep within the CameraRaw library, specifically a routine that is called from the Lightroom Lua worker kernel (AgKernel and lua_pcall). Another thread (Thread 123) was actively in the process of freeing Metal/GPU resources (-[_MTLObjectWithLabel dealloc], -[IOGPUMetalResource dealloc], Espresso::net::~net()), suggesting a race condition where the GPU/AI thread (Thread 123) freed a resource (memory block, texture, CoreML network) while the Worker Thread (Thread 111) was still attempting to use it. This perfectly matches your hypothesis about a race condition in the AI/GPU processing pipeline.