
Frequency Analysis Window Decibel Scale - wrong ? (er, no...)
i'm using 2017 Audition to try to analyze energy distribution of music so i can design speakers that properly allocate available power to different frequency bands ( woofers vs midrange vs tweeters ) ...
i am having an issue ...
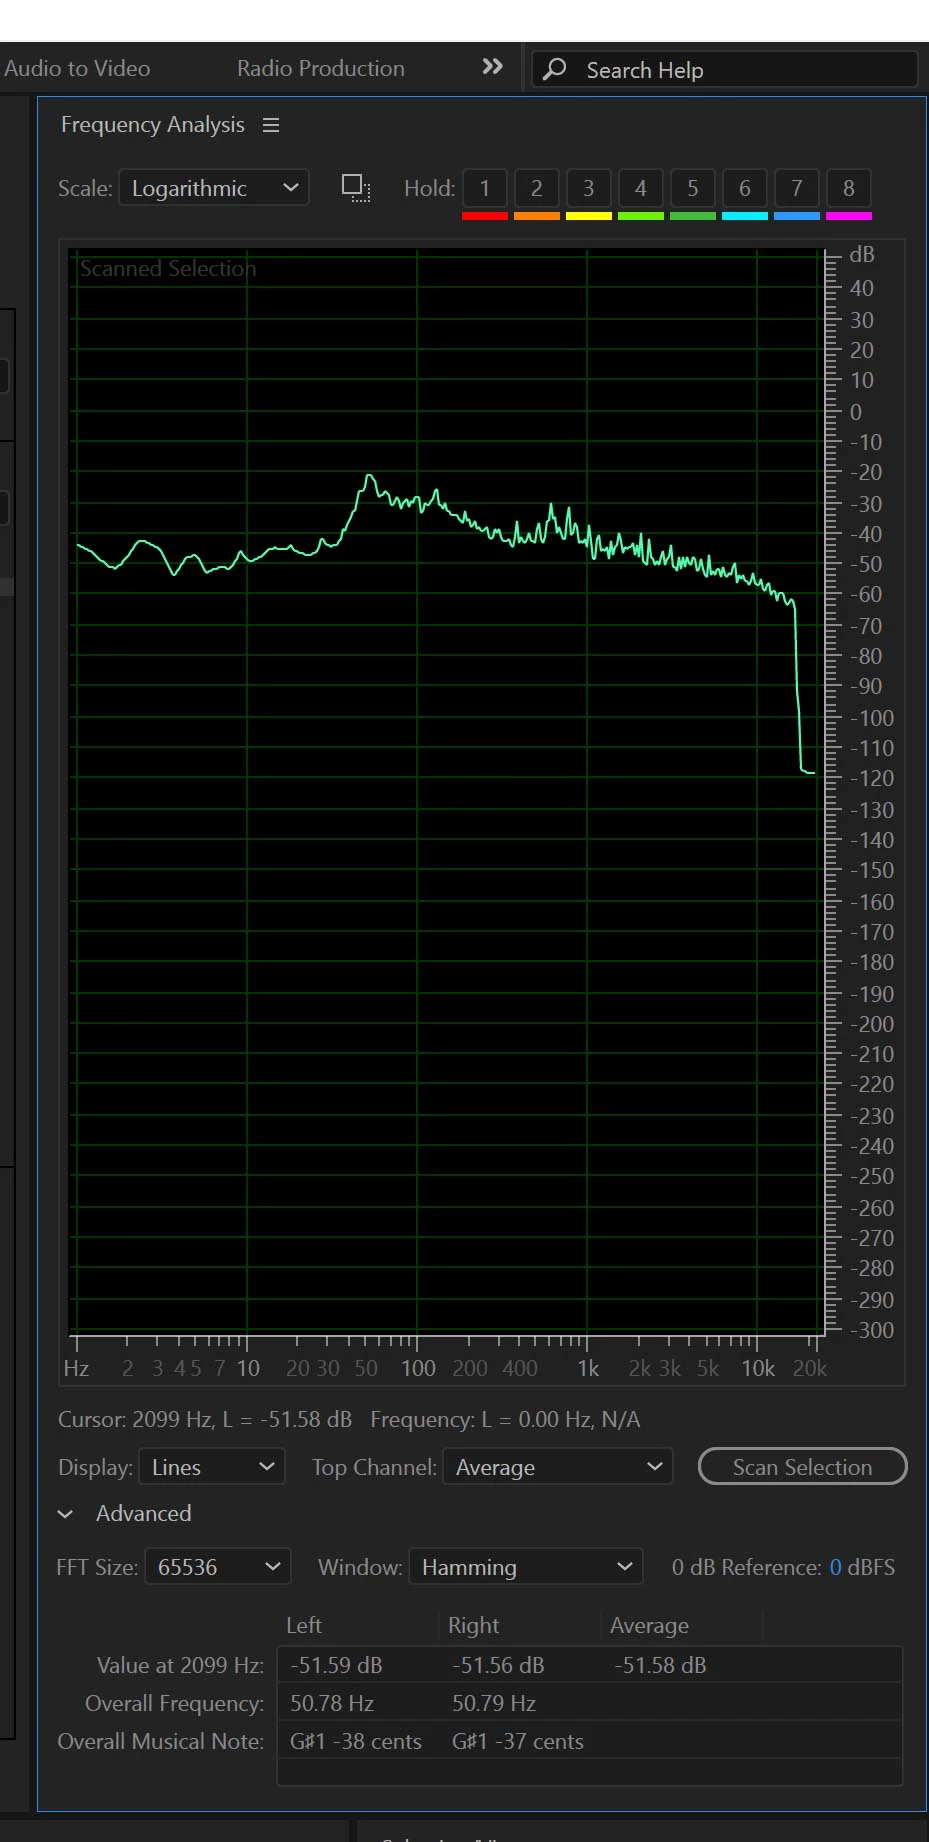
Audition on most tracks shows 30 decibel differential between peak of bass kick at 50 hz and begin of high frequency rolloff at 10 khz ...
that is to say it shows 50 hz as -20 db and 10 khz as -50 db ...
screen shot below is analysis of the entire track " PSY - Gangnam Style " for example ... but other tracks look similar ...
but over at a speaker building forum i saw data posted that shows only 15 decibels for the same drop:
15 decibels is suspiciously HALF of 30 decibels, yet the overall shape of the curve is actually basically the same ...
they both show peak at 50 hz and rolloff beginning at 10 khz ... but the SCALE on one of them seems to be off by a factor of 2X ...
it's also a little suspicious to me that bass peaks in Adobe are already at -20 db, which is kinda low ?
when i design the speaker closely following popular professional designs its power capacity versus frequency ends up matching the curves posted on partsexpress tech talk, which show 15 decibel drop ... which leads me to suspect Adobe scale is measuring something else, or displaying it wrong ...
one possible reason for 2X factor is Voltage vs Power ... 2X Voltage = 4X Power ... though when correctly implemented both will result in 6 decibels but, perhaps it is NOT correctly implemented ?
is the frequency analysis panel any different in more recent versions of Audition ?
even one extra decibel in sound reinforcement can cost thousands and we're talking about 15 decibels of discrepancy here ...
i don't need to know where the error is coming from necessarily just which is the right figure.
thanks in advance.
