
Question
How does Adobe Audition calculate the dB scale in the Frequency Analysis window
Hello, I am a research student at Florida Atlantic University and I have been trying to mimic the waveform obtained in the Frequency Analysis plot:
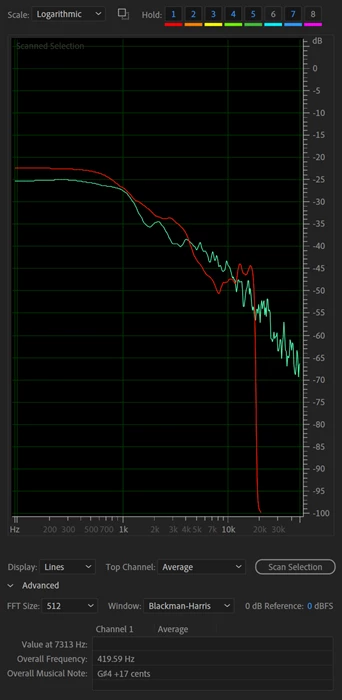
I am able to get the x-axis from the python code that I wrote, but I do not know how to get the dB y-axis. This is what I actually plot from my python code:
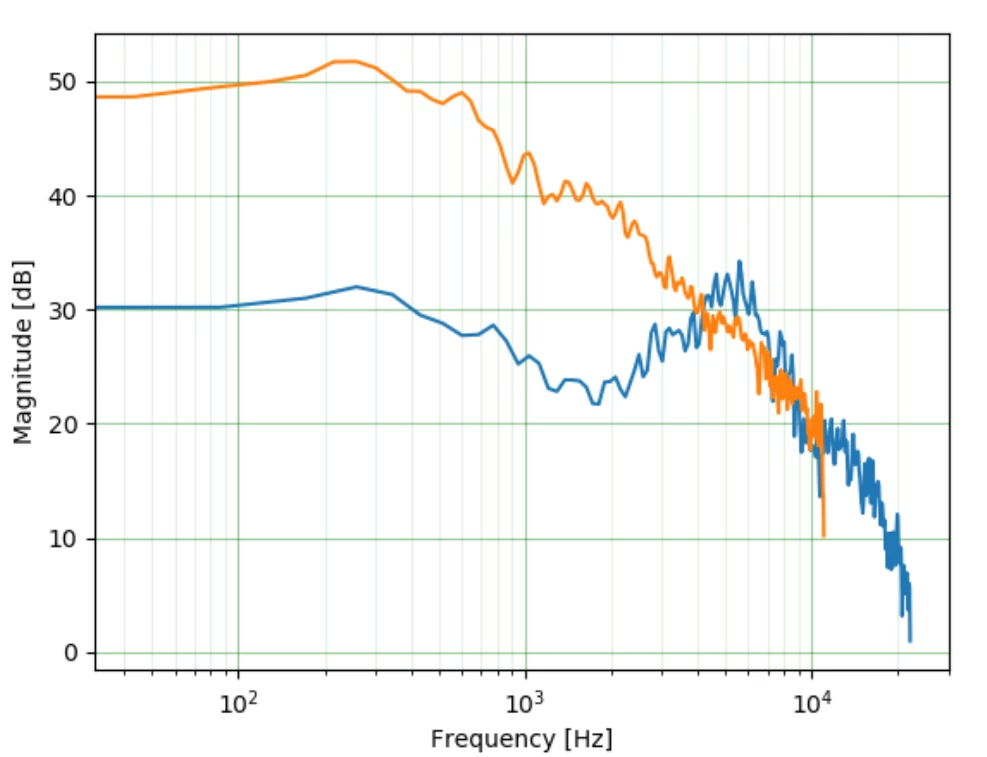
I get a positive magnitude when I do a FFT analysis and plot the waveforms. How is the y-axis value actually calculated? Is there some kind of normalization that takes place?
Any help will be greatly appreciated to help me get a resolution as to the y-axis dB scale. Thanks!
