
Known Participant
September 20, 2018
Question

How is this frequency-analysis display useful?

  • September 20, 2018
  • 1 reply
  • 1288 views

Hi all.

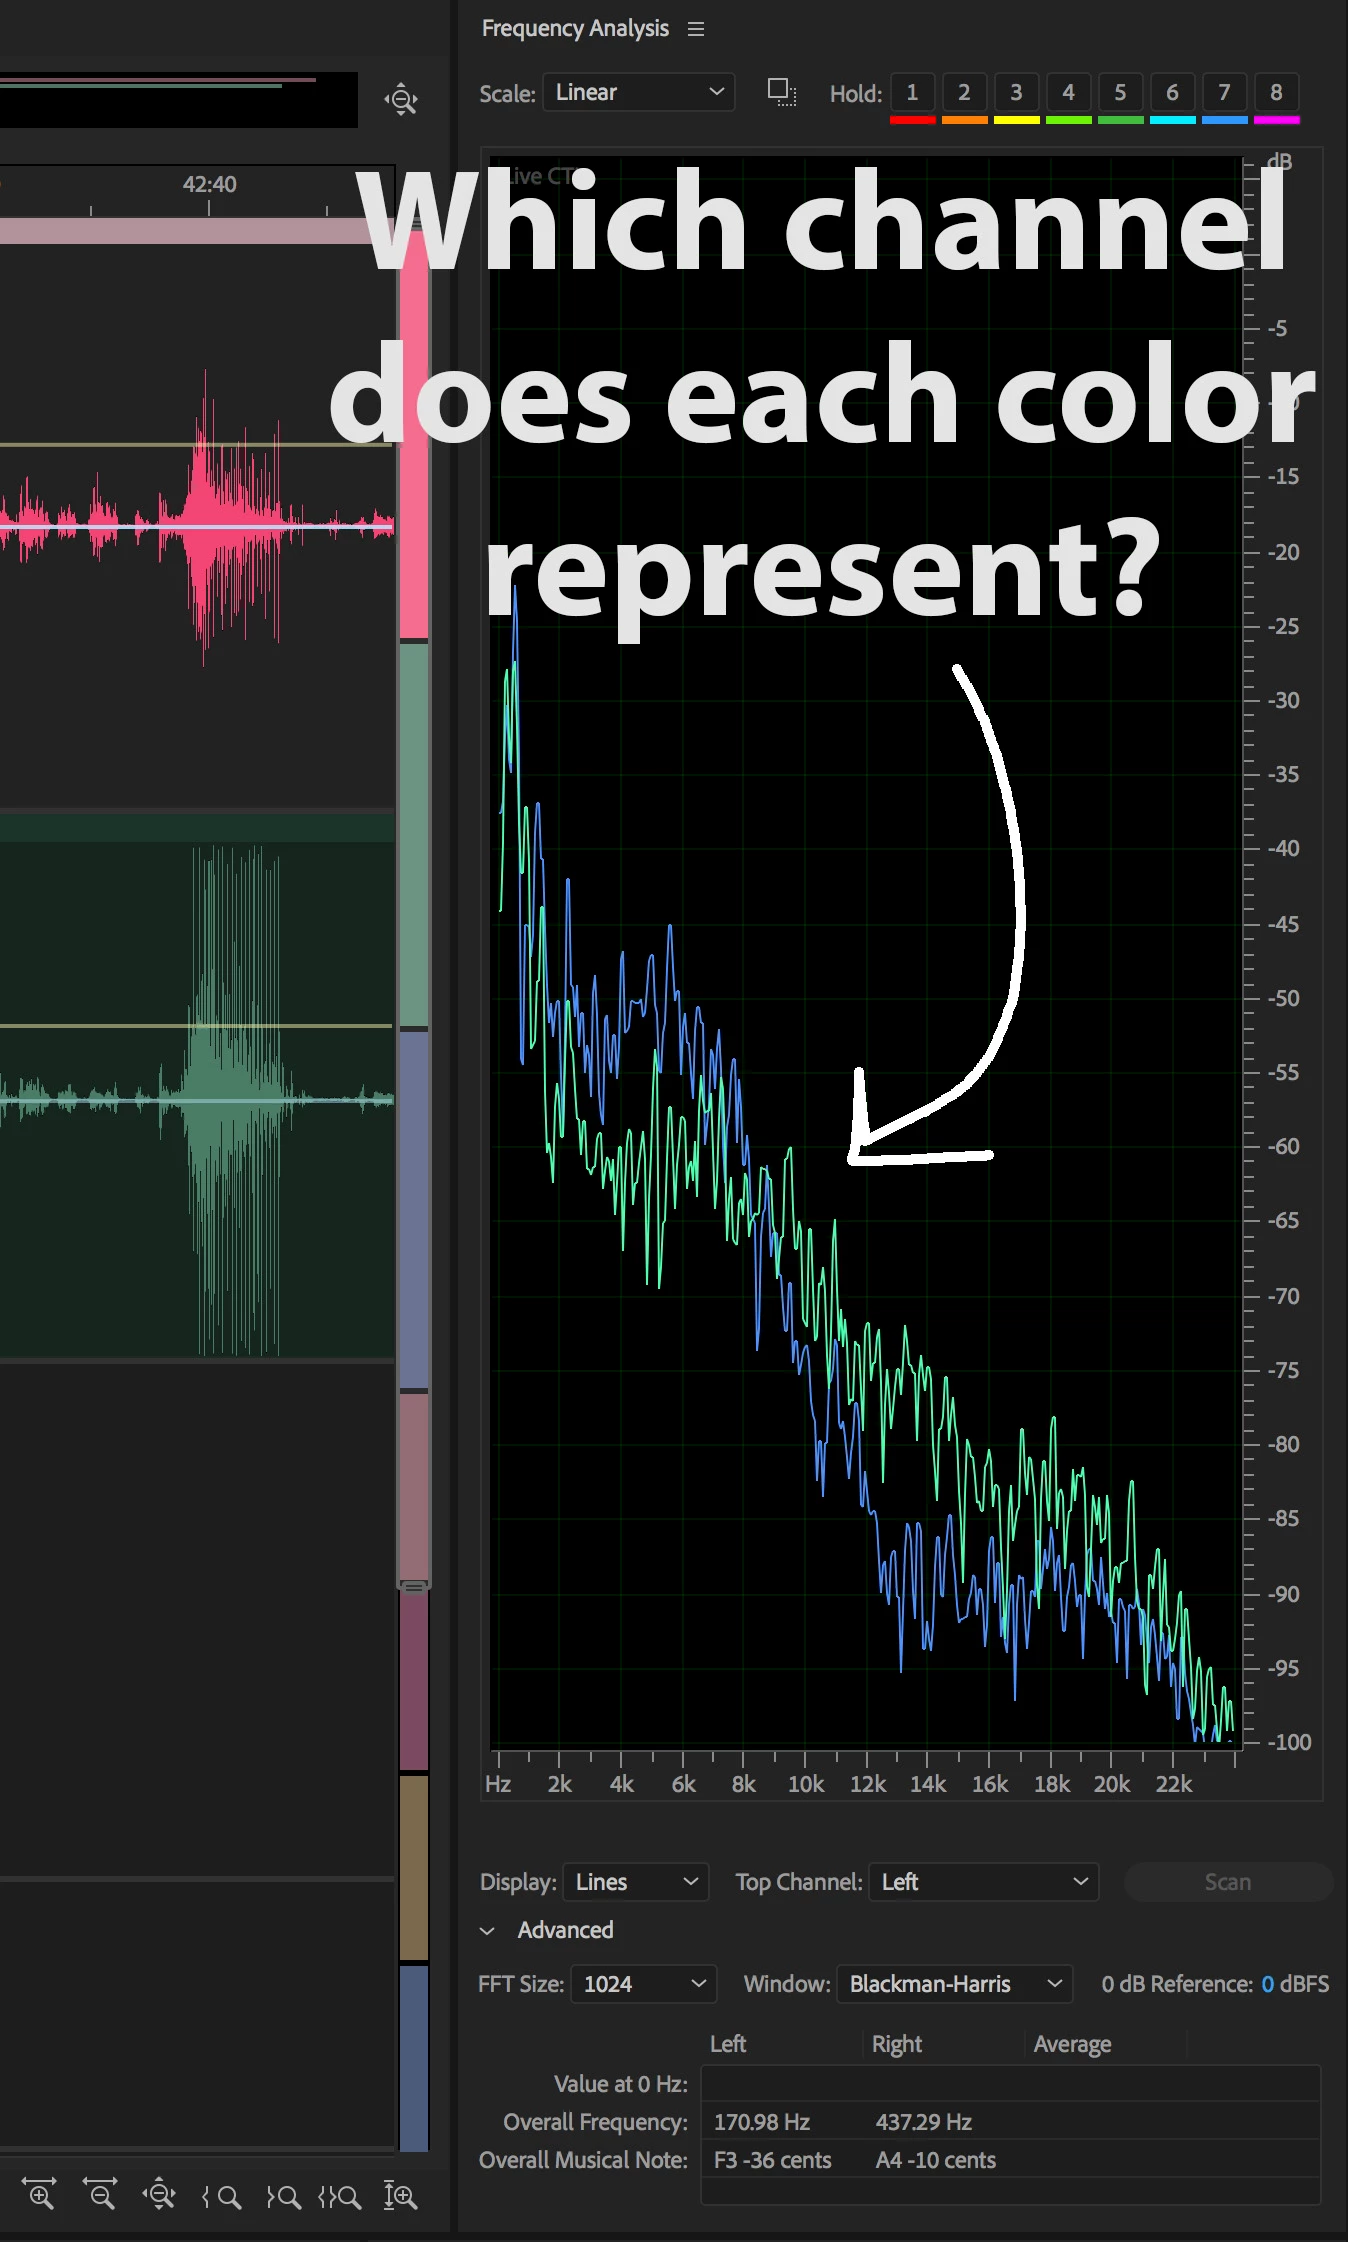
I thought I'd try using the frequency-analysis function to EQ two recordings of the same sounds. But the display is baffling in that it doesn't tell you which channel is depicted by each trace on the graph. Am I just overlooking it?

The colors of the audio tracks aren't even represented in the frequency display, nor is there any legend to tell you which is which.
This topic has been closed for replies.

1 reply

SteveG_AudioMasters_
Community Expert
Community Expert
September 20, 2018

Generally in multitrack it's the green one for the first track - in this simple example it's easy to tell just by using the mute buttons - one display will disappear. But you should also be aware that you are looking at the output from the multitrack mixer if you use it like this, so any settings you have applied to them will also be reflected in the output, which will also vary according to how you've panned it.

Normally you'd use the frequency analysis window in Waveform view, and it's relatively easy to compare two waveforms there - you can hit the 'hold' buttons at the top. If it's stereo hit the first two to save a view of the first one, and the third and fourth to store the second - you can obviously do this for as many waveforms as there are stores. Also note that if you are going to make a reasonably accurate estimate of the EQ, you need to scan a section of the recording before storing it - don't just rely on freezing it whilst it's playing.

Known Participant
September 21, 2018

Thanks for that info.

I'm trying to use this to roughly match EQ between two mono sources, as they play. Thus I need to be in multitrack view.

I don't see why there's no legend anywhere saying what each graph color represents; that seems like a glaring omission. Also, there's a drop-down below the graph that says "Top Channel," and the default is Left.  What on earth does "top" mean, when the graph traces vary widely above and below each other every millisecond?

SteveG_AudioMasters_
Community Expert
Community Expert
September 21, 2018

https://forums.adobe.com/people/Mobius+Strip  wrote

I'm trying to use this to roughly match EQ between two mono sources, as they play. Thus I need to be in multitrack view.

As I said before, that's not the way to do it. You'll fail to come up with anything meaningful like that, as the instantaneous changes will override any clues you get as to the overall shape you're looking for. If you open both files in Waveform view, highlight a representative selection from each one and store it, you'll get a much clearer idea of what the differences are, and be able to work out what the EQ compensation curve needs to be. Personally I can do this better by listening, but it's quite possible to make a reasonable stab at it using the Frequency Analysis window.


I don't see why there's no legend anywhere saying what each graph color represents; that seems like a glaring omission. Also, there's a drop-down below the graph that says "Top Channel," and the default is Left.  What on earth does "top" mean, when the graph traces vary widely above and below each other every millisecond?

The colours don't mean anything until you make a hold selection. It's not a glaring omission at all - it's just the way it works. If you make a selection, scan it and decide to store it, then that selection will acquire the colour of the hold channel you use.

As far as 'top channel' is concerned, this isn't about height on the display, but about which colour being displayed does the displacing. So if Left is on the top, and the right channel has a signal at the same frequency and amplitude as it, then it's the left one you'll see, not the right one. You can see this easily by inspection and a bit of clicking whilst it's running.

The display can also get a lot more complex. If, for instance, you open a 6-channel file in Waveform view, you'll see all the channels at once being displayed, and this is where the 'average' setting becomes useful.

As far as using Frequency Analysis in Multitrack is concerned, this was a relatively late development, and it's only slung across the Master channel output. Apparently some people find it useful, although it's value there is somewhat limited, as to use it effectively you have to manipulate the track Solo buttons rather a lot.