Participant
May 28, 2024
Question

Phase Analysis meaning

  • May 28, 2024
  • 1 reply
  • 197 views

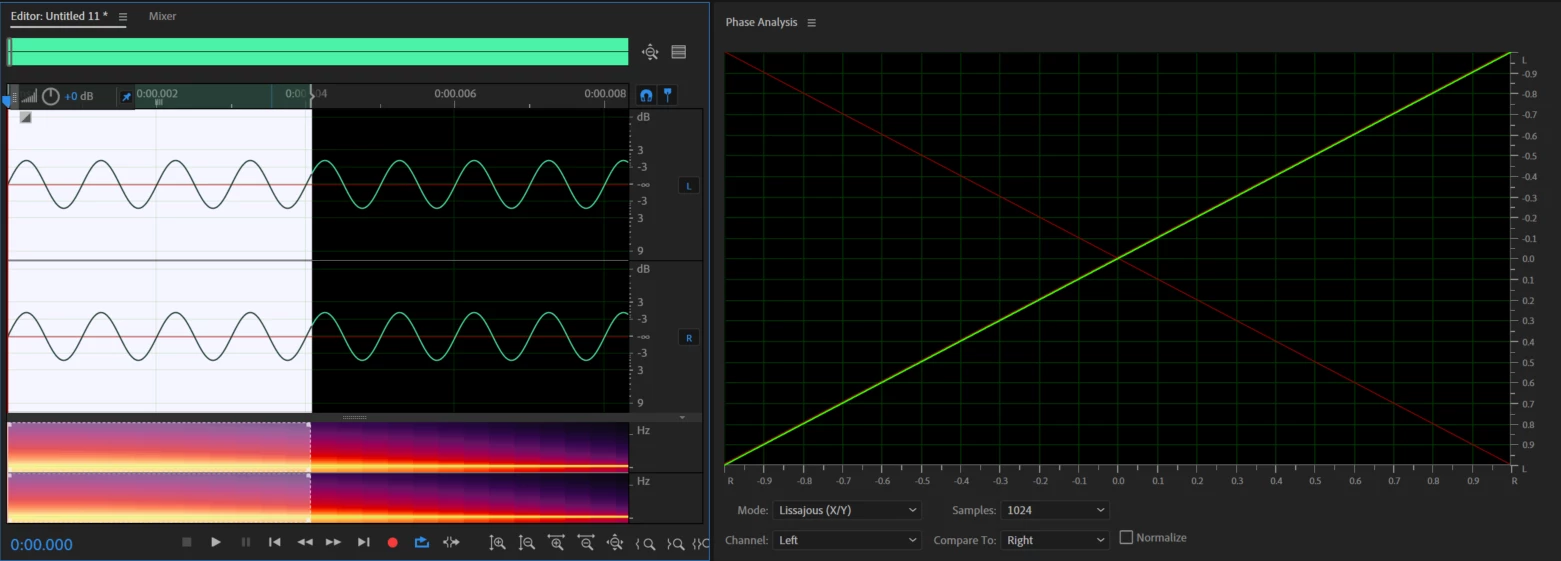
A stereo signal with identical channels appears as a diagonal line from the top right to the bottom left in a Lissajous figure (with the y-axis upper part being negative). Why is it a top right to bottom left diagonal and not a top left to bottom right diagonal? What are the units of the coordinate axes?


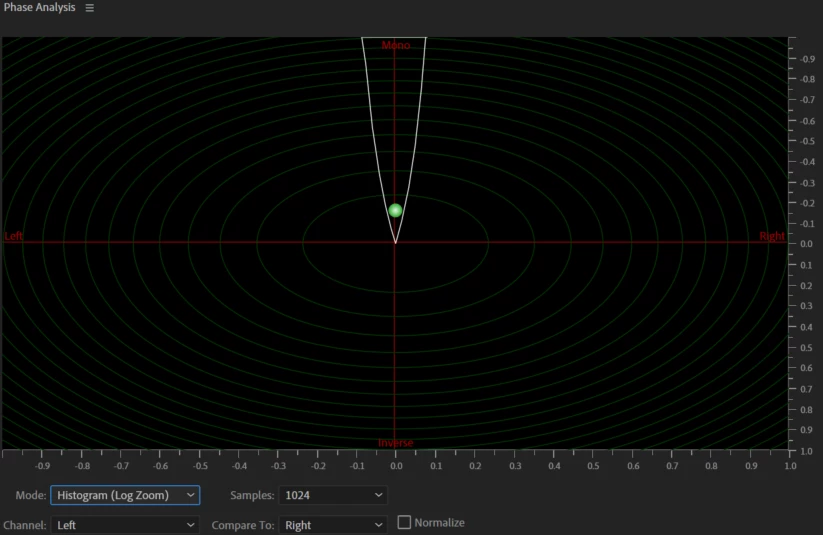
What are the units of the coordinate axes in a Histogram? Compared to a Lissajous figure, what are the different use cases for these representations?


This topic has been closed for replies.

1 reply

SteveG_AudioMasters_
Community Expert
Community Expert
May 28, 2024

The scaling of the two axes is 'normalised' degrees of phase. IOW, 360 degrees scaled from -1 to +1 with zero at the centre. The reason it's this way around is because that's the way the axes have been arranged. The diameter of the green scan is determined by the amplitude of both signals, but the display of this can be determined by normalizing too. It will take a continuous estimate of the amplitude and scale the display accordingly. This is fine, as you aren't really trying to get a measure of amplitude directly from it anyway.