https://forums.adobe.com/people/james+ca60449927 wrote What you're seeing, then, is a (re)construction of the analog signal from the available data, such that the (re)constructed signal is limited to the Nyquist frequency. It is, in other words, the best achievable analog representation of the data from the given digital bandwidth. 1. Is this correct? 2. Is a specific, precise, mathematical description of this available somewhere? 3. ... an here my knowledge of digital audio (or the math behind it) is thin: Is it a unique representation, or does it represent certain choices made by the software--the choice of reconstruction filter? I think it is, because of Shannon/Nyquist, but would appreciate confirmation. |
1. Yes
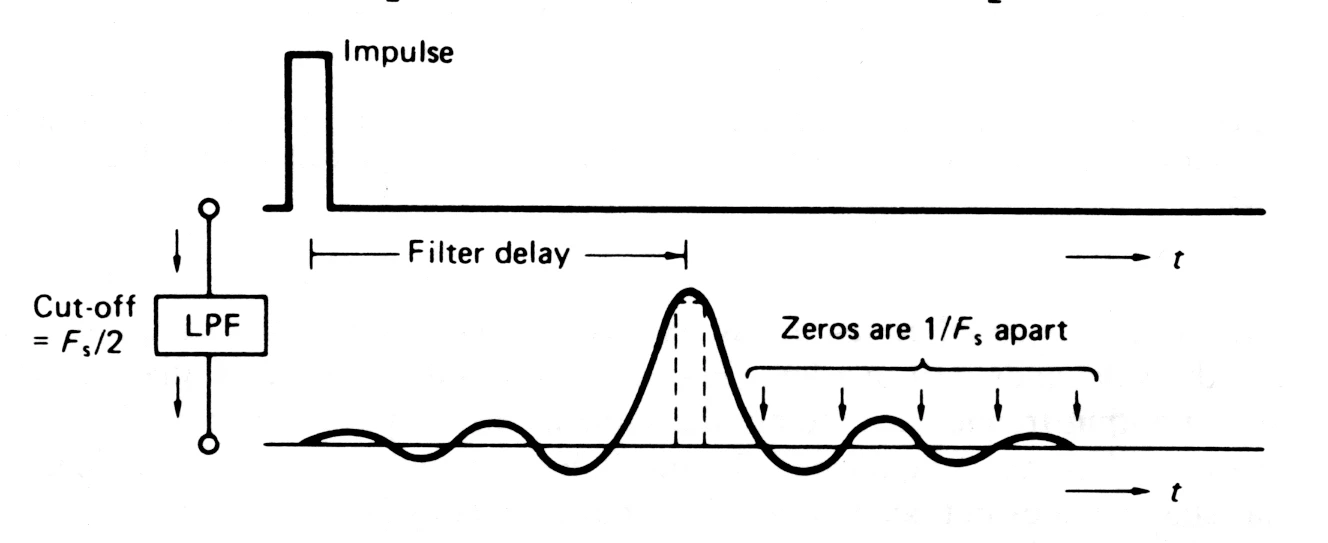
2. Yes. Signal Processing, Modulation and Noise: Amazon.co.uk: J.A. Betts: Books does, according to John Watkinson, (from whom I've nicked a diagram).
3. I can probably explain a little more without getting too carried away...  but yes the choice of reconstruction filter makes a difference. What Audition does is actually easy to establish just by looking at the results you've given (and anyway I've tried this before, so I know it's true); Audition assumes an ideal set of filters. So what you are looking at whenever you do this is the impulse response of a phase-linear ideal low-pass filter.
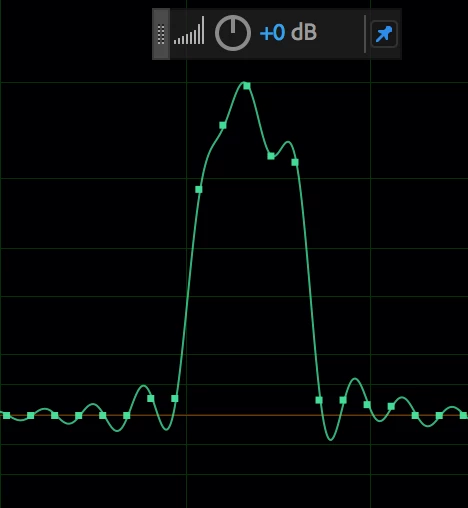
What it comes down to is this; Ideally it looks like a sin x/x waveform in the time domain. This waveform passes through zero periodically. So if the cut-off frequency is half of the sample rate, then the impulse passes through zero at the sites of all other samples. So if your picture above had a single sample displaced from zero, the voltage it represented would be that of the sample alone. Looks like this:
But the continuous time output waveform has to join up the tops of all the input samples, and the rest are all zero. The implication though is that between the sample instants, the filter analogue output is the contribution from loads of impulses, as inevitably the output has to smoothly join the tops together, taking account of the direction of travel. But since the reconstruction filter on the output has the same characteristics as the one on the input, the output will be the same as the band-limited waveform before it was sampled. Which is actually why you never hear the effects of sampling...
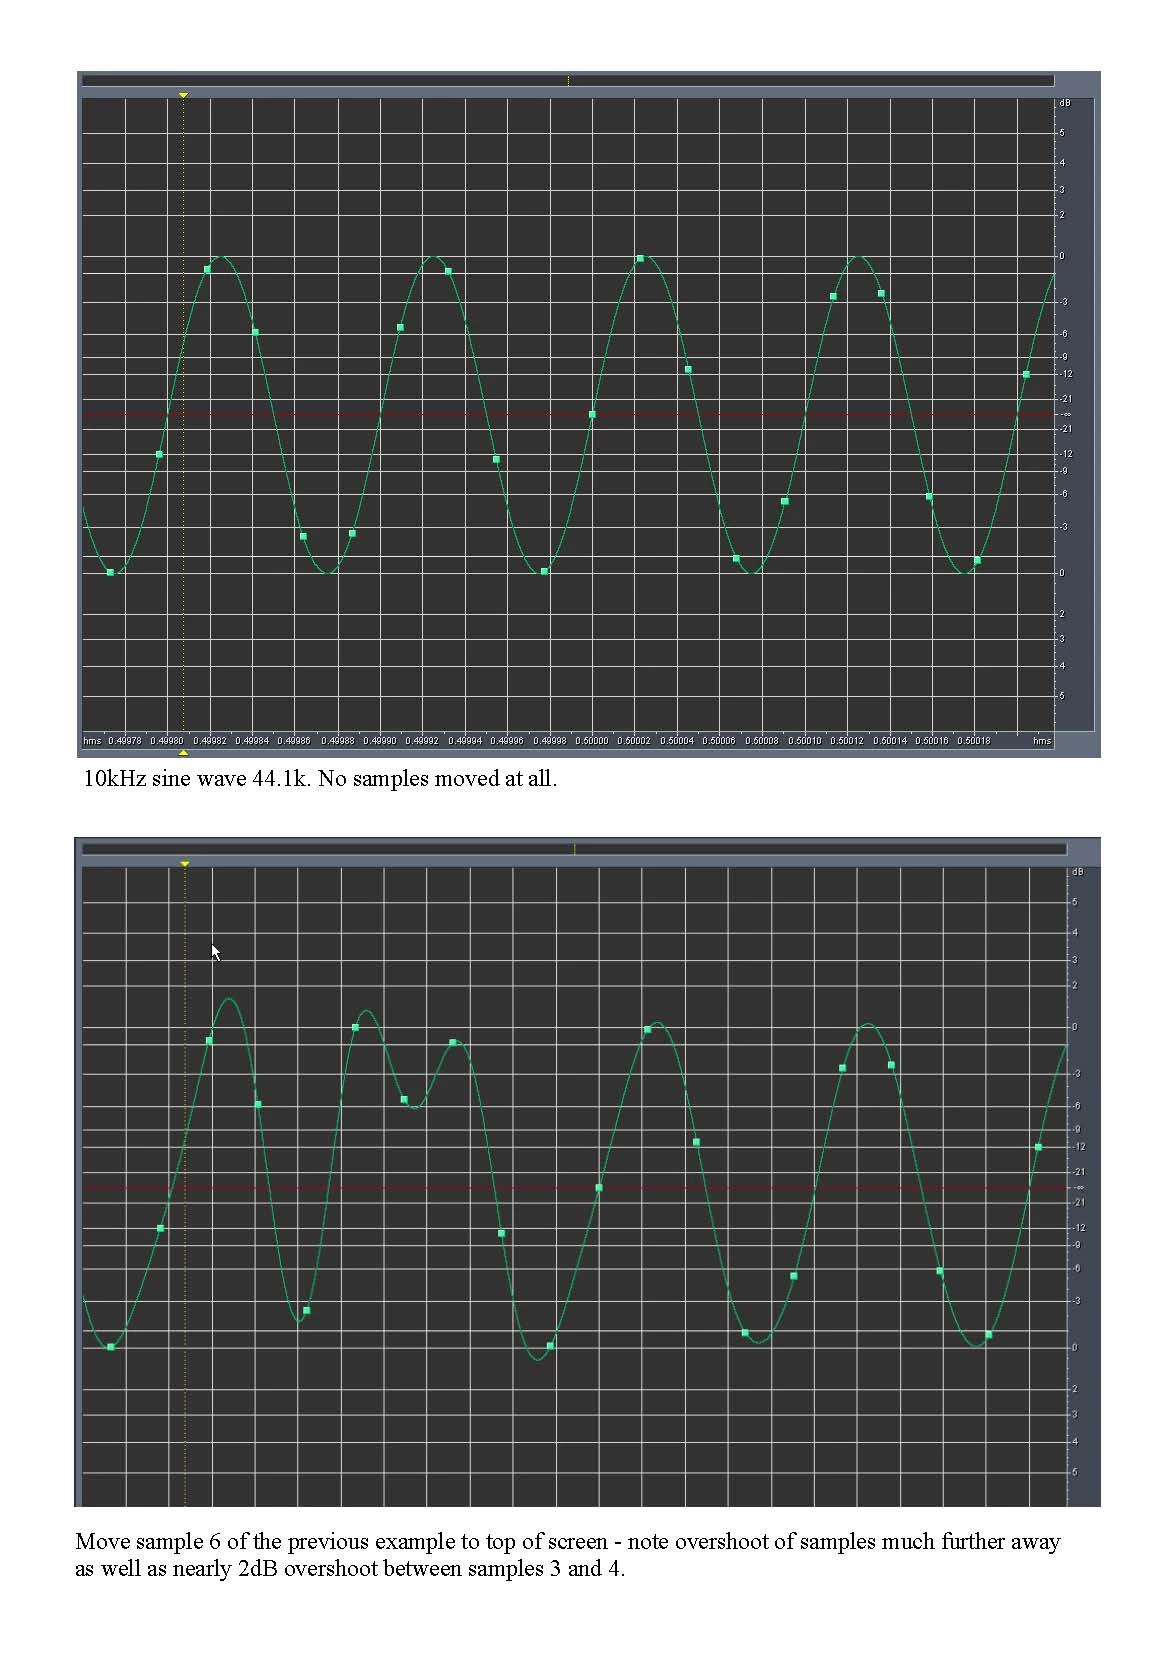
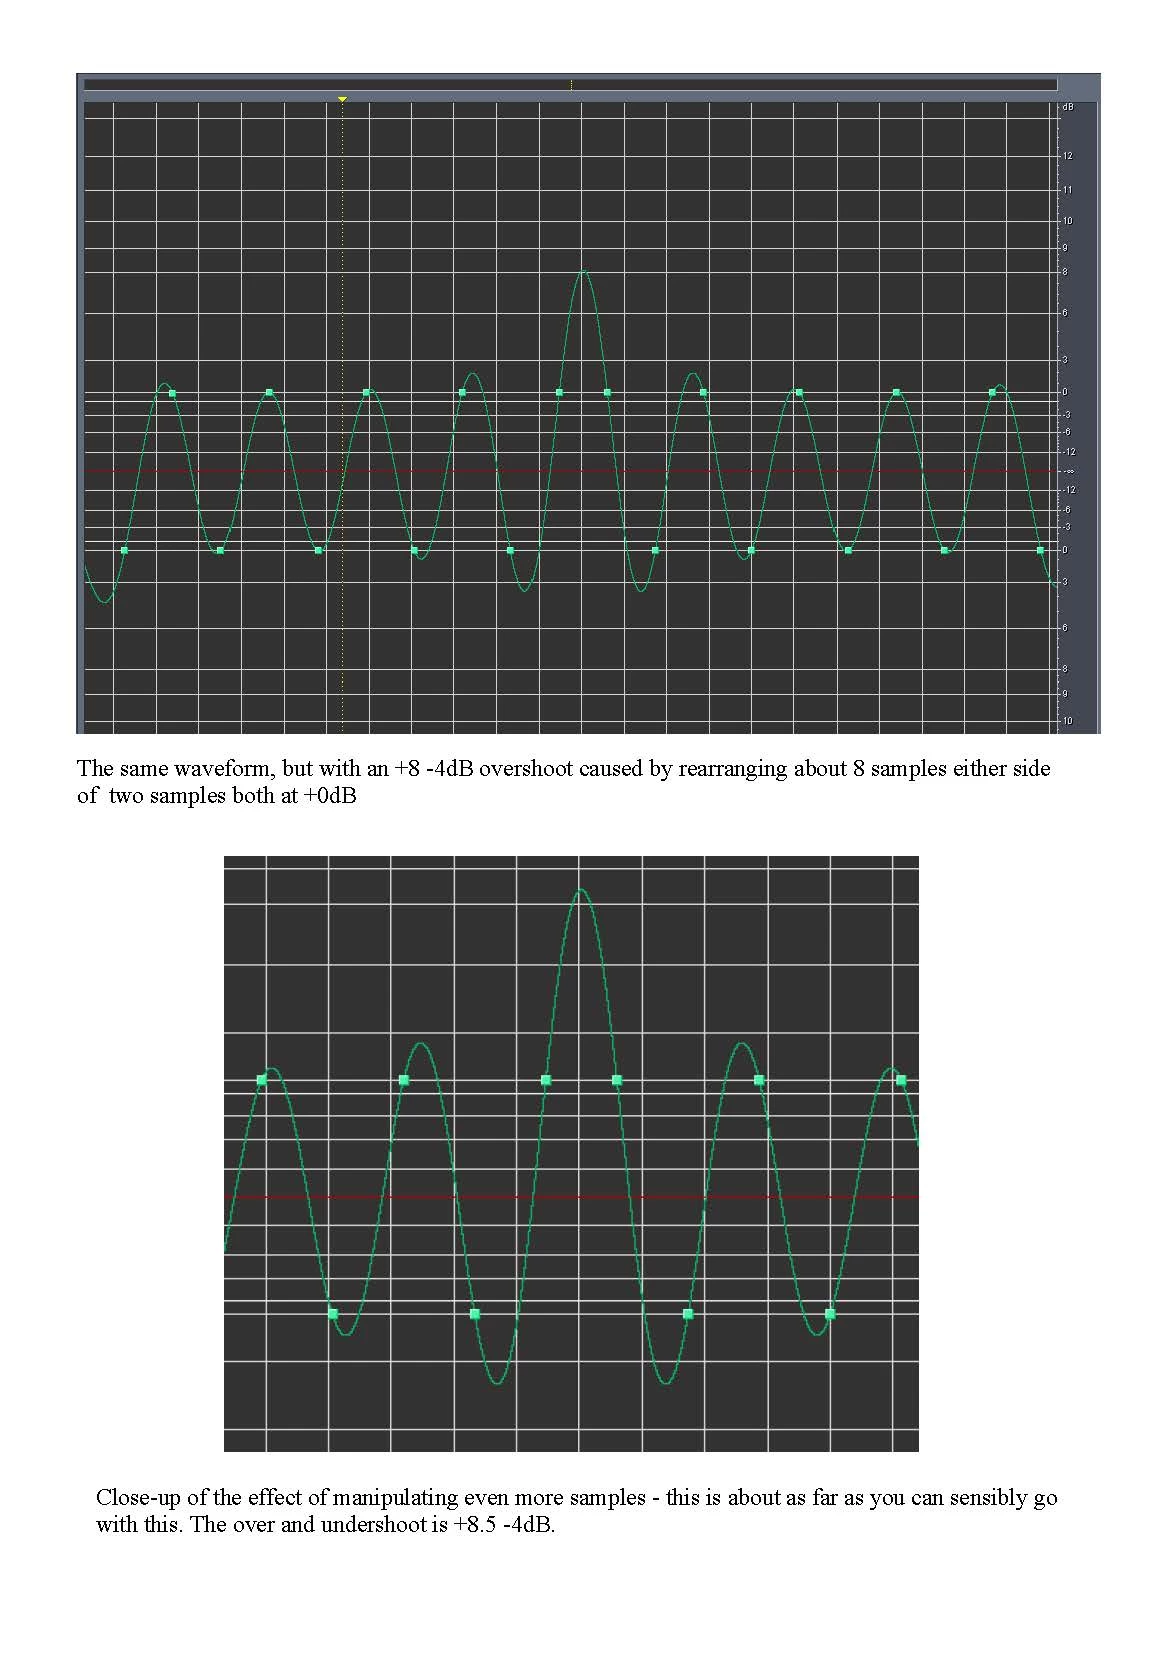
There are implications to this - For instance, it's quite possible for a legitimate waveform to exceed 0dB quite comfortably. Years ago, when Audition also had the ability to move individual samples with a mouse, I created some waveforms that you really wouldn't want to encounter in real life, but which were all legitimate: